
Recent price movements in the oil market indicate ongoing nervousness due to the Israel-Hamas conflict. This uncertainty has also triggered increased demand for safe-haven assets, including gold.
Oil Market’s Resurgence
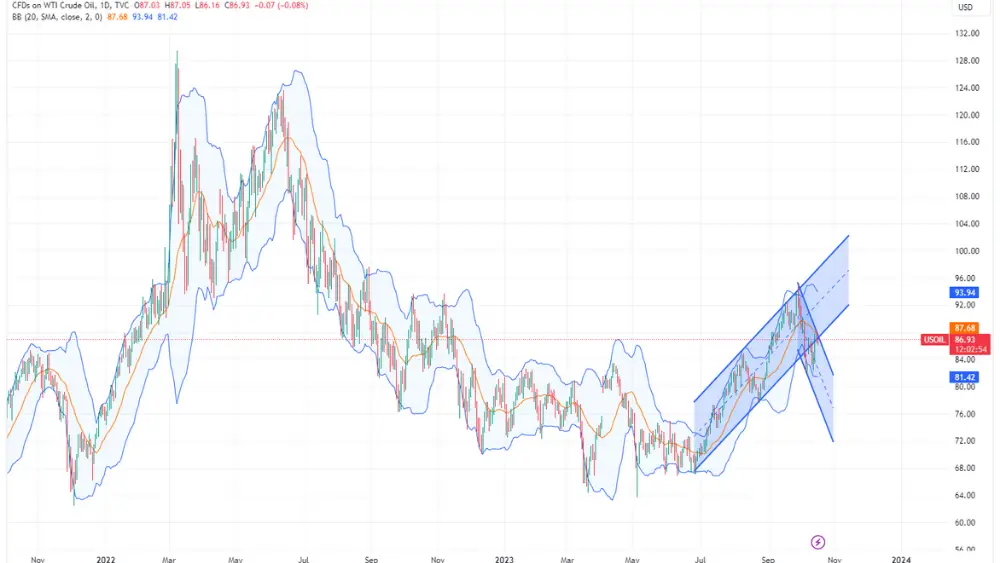
The oil market experienced significant fluctuations on Friday. ICE Brent, the international benchmark, closed 5.69% higher for the day, pushing the front-month contract above $90 per barrel, a level not seen since early October. The ongoing Israel-Hamas conflict remains a driving force behind the oil market’s volatility.
Recent developments have included warnings from Iran regarding the potential for a wider conflict, and reports of Saudi Arabia freezing talks to normalize relations with Israel.
Further amplifying the oil market’s momentum was the imposition of sanctions by the U.S. Treasury on two companies allegedly shipping Russian oil above the G-7 price cap of $60 per barrel while utilizing U.S.-based shipping services.
This marked the first instance of the G-7 price cap enforcement, raising concerns that shipping Russian oil may become more challenging, potentially tightening the market further. The U.S. is likely to tread carefully in enforcing the cap, given the escalating tensions in the Middle East.
However, despite these recent developments, speculative investors remain cautious about entering the oil market. Data on positioning indicates that speculators reduced their net long positions in ICE Brent by 65,161 lots during the last reporting week, bringing the total to 153,174 lots as of the last Tuesday. This reduction was primarily driven by long positions being liquidated.
The past week also saw increased activity from U.S. oil drillers, with the number of oil rigs in the U.S. rising by four to 501, the most significant weekly increase since March. The trajectory of rig count changes in the coming weeks will be closely monitored, as it could signify that U.S. producers are easing their capital discipline, which has been a hallmark of recent years in response to higher oil prices.
Chinese Crude Oil Imports and Other Considerations
In related news, China’s first batch of September trade data, released on Friday, revealed that crude oil imports averaged approximately 11.17 million barrels per day over the month. While this represented an 11% month-on-month decline, it still marked a 14% year-on-year increase. Cumulative imports for the first nine months of the year stood at 11.39 million barrels per day, a 14.5% year-on-year increase.
In the week ahead, the market will continue to closely monitor the evolution of the Israel-Hamas situation. In natural gas markets, potential strike action by workers in Australia at Chevron‘s Gorgon and Wheatstone LNG facilities looms, scheduled for Thursday, should the involved parties fail to resolve their differences in final negotiations.
Gold’s Rally Amidst Uncertainty
In the realm of precious metals, spot gold experienced significant strength on Friday. Prices surged by more than 3.4% in a single day, propelling the market above $1,900 per ounce, a level not seen since mid-September. Falling U.S. treasury yields provided support to the gold market, and the ongoing uncertainty in the Middle East likely increased demand for safe-haven assets.
Despite these positive factors, data on weekly changes in gold ETF holdings do not show strong evidence of investor buying. In fact, ETF holdings in gold decreased by 397,000 ounces last week, totaling 86.7 million ounces. The gold market has now witnessed 20 consecutive weeks of ETF outflows. However, if uncertainty in the Middle East persists and interest rates have reached their peak, gold may become increasingly attractive to investors.

Ukraine’s Growing Grain Harvest
In agricultural news, Ukraine’s Agriculture Ministry reported that the domestic grain harvest has surged by 31% year-on-year, reaching 35.6 million metric tons as of Friday. This increase was primarily driven by a significant rise in corn production, which increased from 1 million tons during the same period last year to 5.8 million tons. Similarly, the soybean harvest increased to 3.8 million tons, up from 1 million tons last year.
Chinese Customs data released on Friday indicated a 23.6% month-on-month and 7.3% year-on-year decrease in China’s soybean imports for September, totaling 7.15 million metric tons. This decline was attributed to weak crush margins, slow pre-sales of soymeal, and poor hog margins. Nevertheless, cumulative imports remained 14.4% higher year-on-year, reaching 77.8 million metric tons for the first nine months of the year.

Lastly, the latest data from the Commodity Futures Trading Commission (CFTC) revealed that money managers reduced their bearish bets in CBOT corn by 46,742 lots, leaving them with 112,691 lots as of October 10. This decrease was driven by short-covering, with gross short positions decreasing by 36,609 lots to 286,547 lots.
For soybeans, speculators reduced their bullish bets by 2,835 lots, leaving them with just 2,166 lots, the lowest since the week ending May 30. CBOT wheat saw speculators adding to their net short positions by selling an additional 5,547 lots, resulting in a net short position of 104,335 lots.