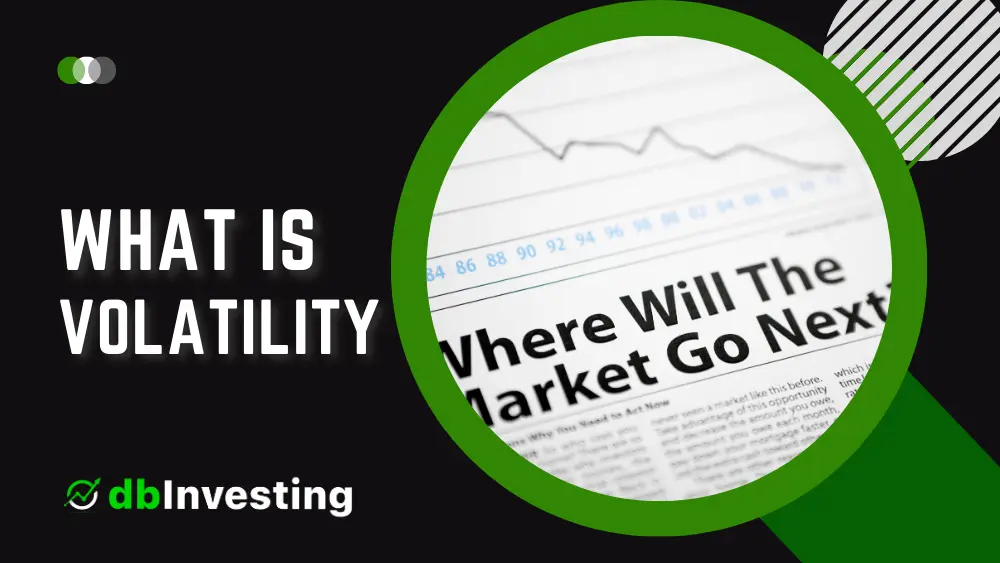
Volatility is a common term in finance, used to describe the degree of variation in the price of a financial asset or market index over time. High volatility means that the price of the asset or index fluctuates widely, while low volatility means that the price changes less frequently or to a smaller extent.
Volatility is an important concept in finance, as it affects investment decisions, risk management strategies, and financial modeling. This article aims to provide a comprehensive understanding of volatility, including its types, calculation methods, measures, examples, management strategies, and relationship with risk.
What Is Volatility?
Volatility refers to the degree of variation in the price of a financial asset or market index over time. It is usually measured as the standard deviation of the asset or index returns, which reflects how much the returns deviate from their average or expected value.
Volatility can be caused by various factors, such as changes in market conditions, economic indicators, news events, investor sentiment, or supply and demand dynamics. Volatility can also differ across different time horizons, from intra-day to weekly, monthly, or annual periods.

Types of Volatility
There are two main types of volatility, namely implied volatility and historical volatility. Both types have different characteristics, uses, and limitations.
- Implied Volatility: Implied volatility is based on the prices of options and reflects the market’s expectation of future volatility. It is a forward-looking measure of volatility, as it captures the market’s perception of the uncertainty or risk associated with an asset or index over a certain period, usually the expiration date of the options. Implied volatility is used in option trading strategies, such as straddles or strangles, which involve buying or selling options to profit from expected price movements.
- Historical Volatility: Historical volatility is based on past price data and reflects the actual volatility of an asset or index over a certain period. It is a backward-looking measure of volatility, as it describes how much the price of an asset or index has fluctuated in the past. Historical volatility is used in risk management and portfolio optimization, as it helps to estimate the potential risk or return of an investment based on its historical behavior.
How to Calculate Volatility?
Volatility can be calculated using different methods, depending on the type of data and the purpose of the analysis. The most common methods of calculating volatility are:
- Historical Volatility: This method uses past price data to estimate the future volatility of an asset or index. It calculates the standard deviation of the asset or index returns over a specified time period, such as the last 30, 60, or 252 days. Historical volatility is based on the assumption that the future price movements of an asset or index will follow the same pattern as its past price movements.
- Implied Volatility: This method uses option prices to infer the expected volatility of an asset or index in the future. It reflects the market’s perception of the uncertainty or risk associated with the asset or index, as implied by the prices of the options. Implied volatility can be calculated using various option pricing models, such as the Black-Scholes model or the binomial model.
Other Measures of Volatility
Apart from implied and historical volatility, there are other measures of volatility that are used in finance and economics, such as:
- Beta: Beta measures the sensitivity of an asset or portfolio to the movements of a benchmark index, such as the S&P 500. A beta of 1 means that the asset or portfolio moves in the same direction and magnitude as the benchmark, while a beta of less than 1 means that the asset or portfolio is less volatile than the benchmark, and a beta of more than 1 means that the asset or portfolio is more volatile than the benchmark.
- Average True Range (ATR): ATR is a technical indicator that measures the volatility of an asset or market index by taking into account the difference between the high and low prices over a certain period. ATR is often used in trend-following strategies, as it helps to identify the strength of a trend and the potential risk or reward of a position.
- Standard Deviation: Standard deviation is a statistical measure of the dispersion of a set of data around its mean or average value. It is widely used in finance to calculate the volatility of an asset or index, as it reflects the degree of variation or fluctuation in the price or return series.
- Example of Volatility
To illustrate the concept of volatility, let’s take the example of the stock market index, such as the S&P 500. Suppose that the S&P 500 had an average annual return of 10% over the last 10 years, with a standard deviation of 15%.
This means that the actual return of the index in any given year could range from -5% to +25%, with a 68% probability. In other words, the S&P 500 is considered a volatile index, as its returns can vary widely from year to year.
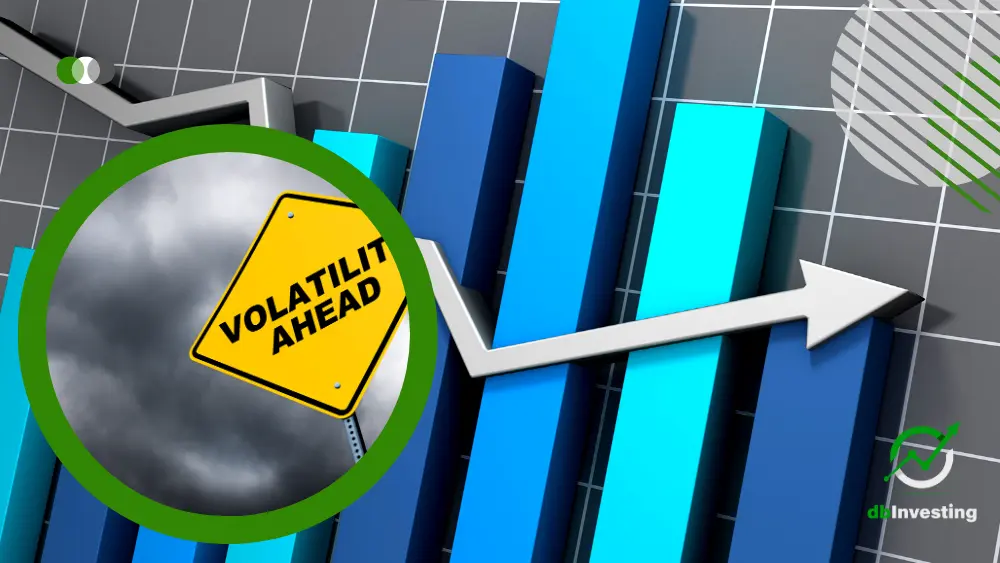
Tips on Managing Volatility
Volatility can be both a risk and an opportunity, depending on the investment goals and strategies of the investor. Here are some tips on managing volatility:
- Diversification: Diversification is a common risk management strategy that involves spreading the investment across multiple assets or sectors. By diversifying the portfolio, investors can reduce the exposure to the volatility of a single asset or market and increase the potential for long-term returns.
- Hedging: Hedging is a risk management technique that involves taking an offsetting position in another asset or derivative instrument to protect against potential losses from adverse price movements. For example, buying put options on a stock or index can hedge against a potential decline in its price.
- Asset Allocation: Asset allocation is a portfolio management strategy that involves dividing the investment among different asset classes, such as stocks, bonds, and cash, based on the investor’s risk tolerance and investment objectives. By allocating the assets across different classes, investors can balance the risk and return potential of the portfolio and reduce the impact of market volatility.
Is Volatility the Same as Risk?
Volatility and risk are related concepts, but they are not the same. Volatility refers to the degree of variation or fluctuation in the price or return of an asset or index, while risk refers to the potential loss or harm that an investor faces from investing in an asset or portfolio.
Volatility can be a source of risk, as it can lead to unpredictable price movements and potential losses, but it can also be an opportunity for profit if managed properly. Risk involves various factors, such as market, credit, liquidity, operational, and systemic risks, that affect the investment performance and safety.
Is Volatility a Good Thing?
Volatility can be a good thing or a bad thing, depending on the investment goals and strategies of the investor. For short-term traders or speculators, volatility can provide opportunities for quick profits or losses, depending on the direction of the price movement. For long-term investors, volatility can be a source of risk or opportunity, depending on the quality and diversification of the portfolio.
In general, high volatility can increase the potential returns of an investment, but also increase the potential losses, while low volatility can reduce the potential returns, but also reduce the potential losses. Therefore, investors should consider their investment horizon, risk tolerance, and investment objectives when assessing the impact of volatility on their portfolio.
What Is the VIX?
The VIX, or the CBOE Volatility Index, is a popular measure of market volatility that is based on the options prices of the S&P 500 index. The VIX is often called the “fear index,” as it reflects the degree of fear or uncertainty among investors regarding the future direction of the market.
The VIX is calculated by taking the weighted average of the implied volatility of the S&P 500 options with a 30-day expiration period. A high VIX value indicates that investors expect high volatility and potential declines in the market, while a low VIX value indicates that investors expect low volatility and potential gains in the market.
Conclusion
Volatility is a key concept in finance and investing that measures the degree of variation or fluctuation in the price or return of an asset or index. Volatility can be calculated and measured by various methods, such as implied volatility, historical volatility, beta, average true range, and standard deviation. Volatility can be both a risk and an opportunity, depending on the investment goals and strategies of the investor.
Investors can manage volatility by diversifying the portfolio, hedging the risk, and allocating the assets across different classes. The VIX is a popular measure of market volatility that reflects the degree of fear or uncertainty among investors regarding the future direction of the market. By understanding and managing volatility, investors can enhance their investment performance and achieve their financial goals.