The recent surge in US stock market indices is showing signs of faltering, with both the S&P 500 and the Dow Jones Industrial Average (DJIA) breaching crucial support levels. Additionally, the Nasdaq 100 index is displaying vulnerability due to a potential formation of a bearish pattern.
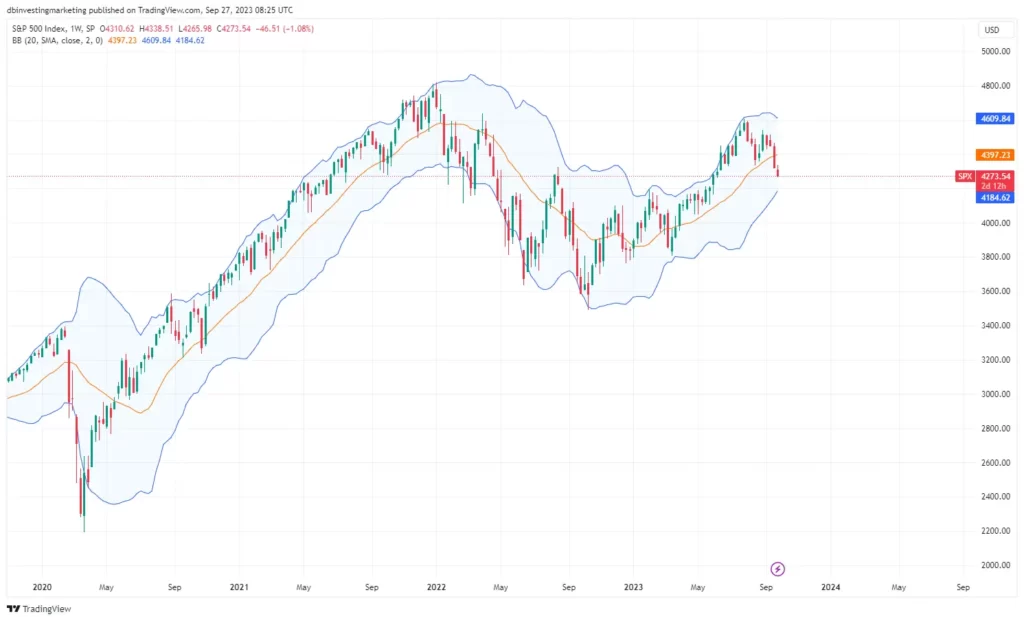
S&P 500
Breaking Below Key Support The S&P 500 has experienced a significant drop below a critical convergence of support levels, which include the June low of 4325, the 89-day moving average, and the lower boundary of the Ichimoku cloud on the daily charts. We had highlighted this risk in our previous update.
This break is of utmost importance as it marks the end of the pattern characterized by higher highs and higher lows that had been intact since the start of the year. Consequently, the path has now opened up towards the 200-day moving average, currently around 4195. If the downward momentum continues, the next level of support lies at the late-April low of 4050.
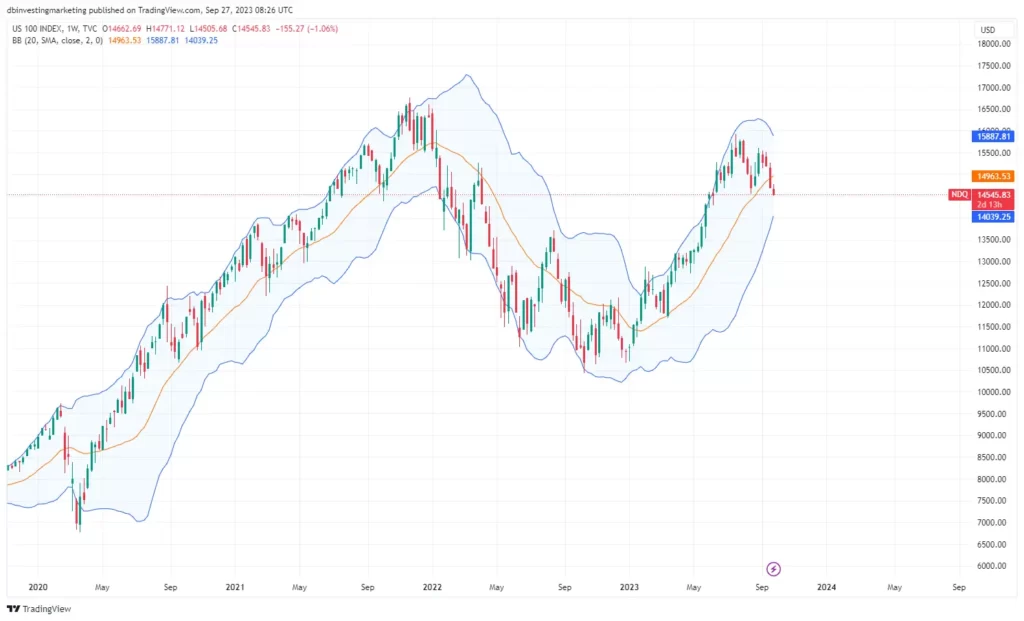
Nasdaq 100
Potential Head & Shoulders Formation The Nasdaq 100 index is currently testing a critical horizontal trendline dating back to June, situated around the 14550-14560 range. A breach of this trendline could trigger a head and shoulders pattern, with the left shoulder corresponding to the June high, the head to the July high, and the right shoulder to the early-September high. If this pattern is confirmed, the anticipated price target would be approximately 13200, which aligns closely with the 200-day moving average.
Furthermore, when considering the broader market perspective, as highlighted in our recent update, there has been a noticeable lack of strong momentum on the monthly charts when compared to the significant rally observed since late 2022. This raises concerns of a gradual weakening, reminiscent of the slow decline observed in the gold market since May.
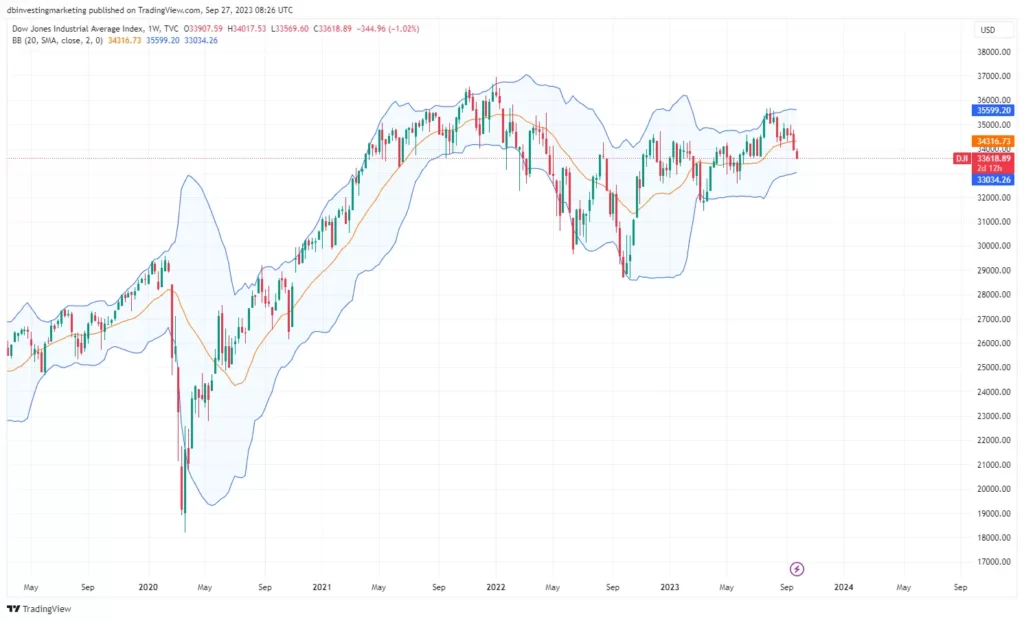
Dow Jones Industrial Average
Support Levels Cracking Despite a bullish breakout in July, the Dow Jones Industrial Average has struggled to maintain its upward momentum. This week, the index has broken below a previously established resistance-turned-support level, represented by a horizontal trendline dating back to July and situated around 34300.
This breach has initiated a potential downward path, initially targeting the May low of 32600, and possibly extending further to the 200-week moving average, currently positioned at 31720. This coincides with the March low, adding to the significance of this support zone.