
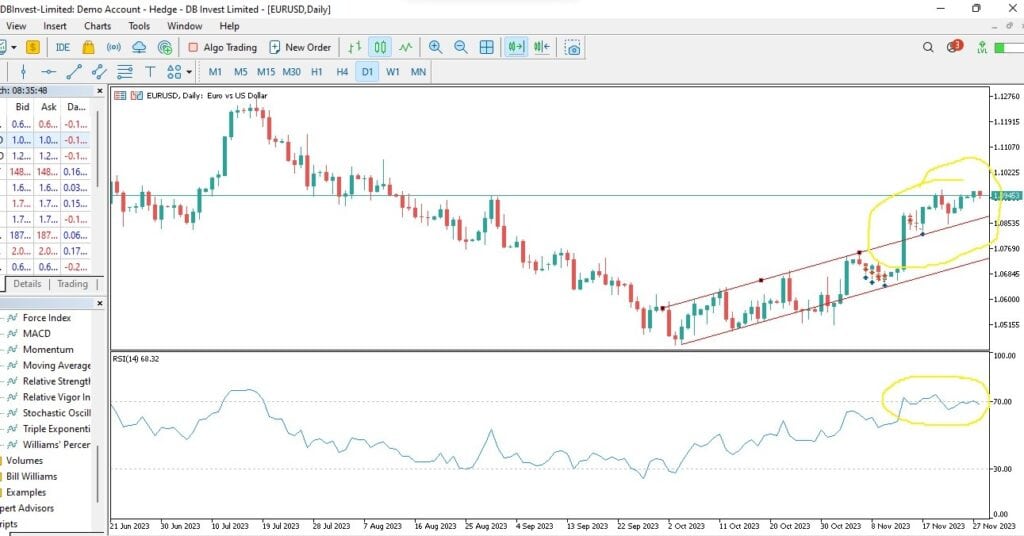
It’s been a great weekly run for the Euro as it obtained some nice gains during the course of last week with EURUSD pushing past channeling resistance levels for approximately two weeks. At the moment, the bulls seem to be struggling to push past 1.9560 with signs of an imminent pull back or reversal altogether.
From a Technical Standpoint, on the daily chart, we saw price push past the resistance level of an ascending channel on 14/11/2023, indicating a strong bullish pressure. We also see price still hovering around overbought levels on the RSI, preparing to head back below the 70-Water Mark and hence
indicating that we may either have a brief pull back which may be a consolidation of a further bullish run or a complete reversal of price action.
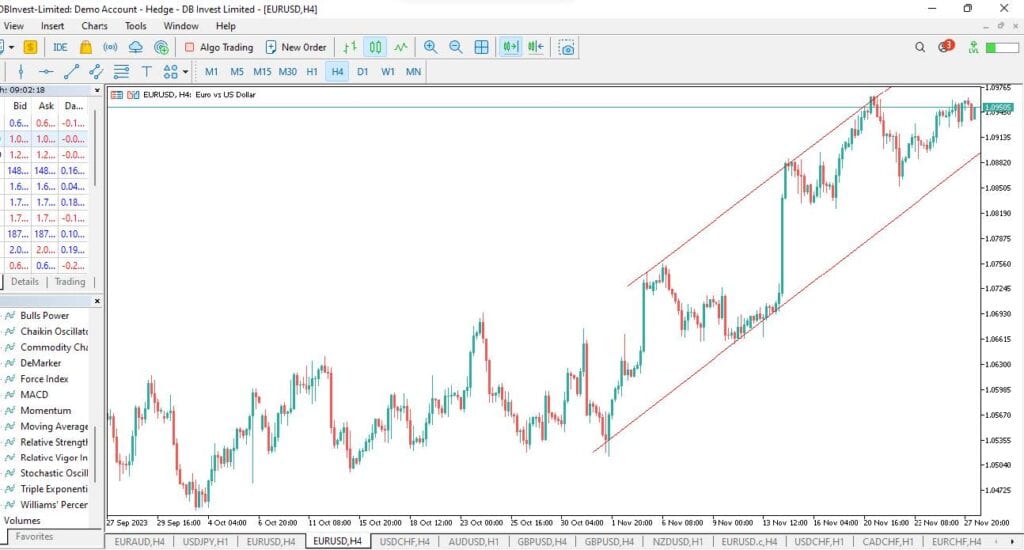
On The 4-hr Chart, we can see the following
- Two significant gaps above the 8th Exponential Moving Average followed by another wide gap between the 8-EMA and 14-SMA in two significant locations in relation to current price action.
- We also see price currently moving within an ascending channel but struggling to reach resistance levels of that channel.
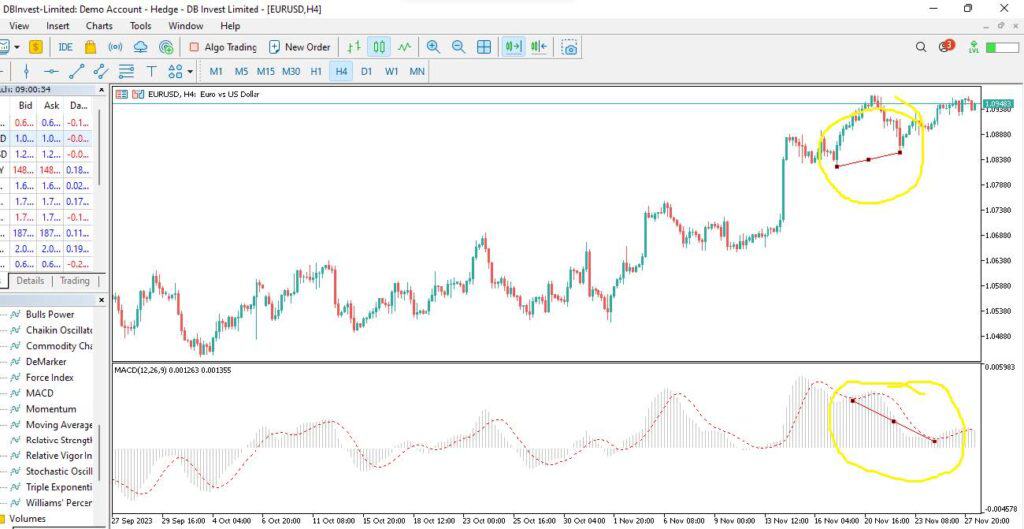
- We also see negative divergence on MACD (on connecting the lower waves).
If price heads back towards the 50-SMA (Thich Green Line), and closes below the support level of the channel, we would most likely see a Heads-and Shoulders pattern form further suggesting that a brief pull back/reversal is imminent.
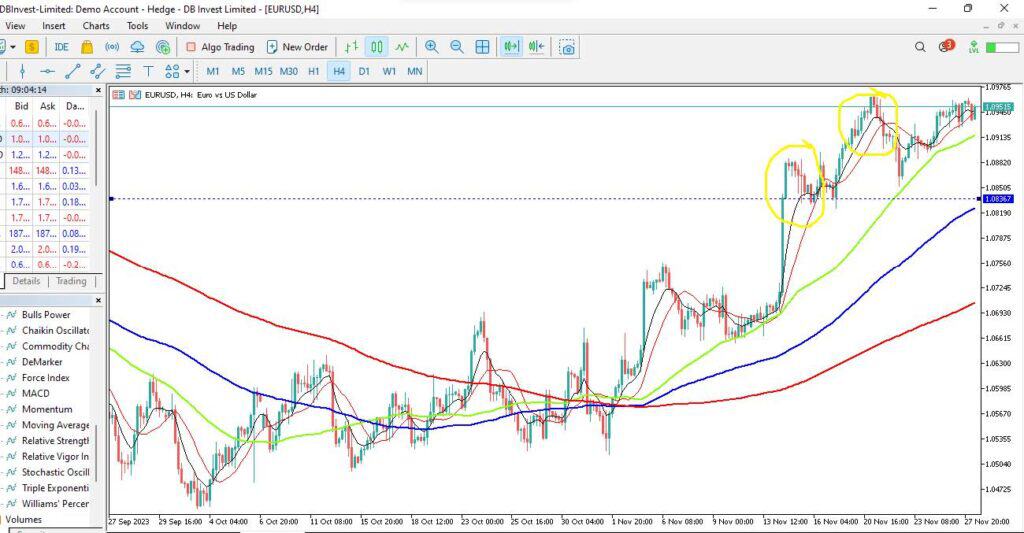
If price heads back towards the 50-SMA (Thick Green Line), and closes below the support level of the channel, we would most likely see a Heads-and Shoulders pattern form, further suggesting that a brief pull back/reversal is imminent.
However, If price continues to be bullish within the ascending channel, It may be headed for the next Psychological level of 1.1000 which was last broken through by the bears earlier in August 2023.
From a Fundamental Standpoint, the overall news/economic data released in the previous week seemed to bearish for the dollar. The following highlights within the week were noted:
- The dollar index (DXY00) on Monday fell by -0.18%.
- U.S October new home sales fell -5.6% m/m to 679,000, weaker than expectations of 721,000.
- The November Dallas Fed manufacturing outlook of general business activity unexpectedly fell – 0.7 to a 4-month low of -19.9, weaker than expectations of an increase to -16.0.
- Also, hawkish comments Monday from ECB President Lagarde gave EUR/USD a boost when she said inflation remains too high and has been high for too long and that the ECB is keeping a close eye on the exchange rate.
We expect to see some significant movement on the pair on Wednesday (29/11/2023) riding on economic data such as German Prelim CPI m/m, Spanish Flash CPI y/y, and the U.S Prelim GDP q/q.
Let’s see what the week holds for the EURUSD as Traders get itchy for some action on the pair even as the signals pile up.
Happy Trading!