
The Dow Jones Industrial Average (DJIA), often simply referred to as the Dow Jones or Dow, is one of the most well-known and widely followed stock market indices in the world. Established in 1896 by Charles Dow and Edward Jones, this index has played a pivotal role in tracking the performance of the United States’ stock market.
In this comprehensive article, we will delve into the history, composition, significance, and various aspects of the Dow Jones Industrial Average, including its chart and constituent stocks.
History of the Dow Jones Industrial Average
The Dow Jones Industrial Average has a rich history that spans over a century. It was created as a tool to measure the overall performance of the U.S. stock market. Initially, the index included only 12 industrial companies, and its first closing value was 40.94 on May 26, 1896. Over time, the index expanded and evolved to reflect the changing dynamics of the American economy.
Understanding the DJIA
The Dow Jones Industrial Average is often referred to as a “price-weighted” index. Unlike other indices like the S&P 500, which are weighted by market capitalization, the DJIA calculates its value by summing up the stock prices of its constituent companies and dividing by a divisor.
This unique methodology has both strengths and limitations, as it can be influenced by the absolute price changes of the stocks within the index.
Constituent Stocks
The Dow Jones Industrial Average consists of 30 large, blue-chip companies representing various sectors of the U.S. economy.
These companies are carefully selected by the index’s governing body, the S&P Dow Jones Indices, and are often considered industry leaders. Some of the well-known Dow components include Apple, Microsoft, Coca-Cola, and Goldman Sachs.
| # | Company | Symbol | Weight | Price | Chg | % Chg |
|---|---|---|---|---|---|---|
| 1 | Unitedhealth Group Inc | UNH | 9.889526 |  505.22 505.22 | -0.23 | (-0.05%) |
| 2 | Goldman Sachs Group Inc | GS | 6.373112 |  326.72 326.72 | 2.90 | (0.89%) |
| 3 | Microsoft Corp | MSFT | 6.154111 | 313.77 | 1.63 | (0.52%) |
| 4 | Home Depot Inc | HD | 5.939956 | 303.08 | 0.54 | (0.18%) |
| 5 | Caterpillar Inc | CAT | 5.315513 | 270.45 | 0.93 | (0.35%) |
| 6 | Mcdonald’s Corp | MCD | 5.228495 | 268.53 | 0.81 | (0.30%) |
| 7 | Amgen Inc | AMGN | 5.171903 | 268.58 | -0.46 | (-0.17%) |
| 8 | Visa Inc | V | 4.522654 | 230.20 | 0.55 | (0.24%) |
| 9 | Salesforce Inc | CRM | 3.99899 | 203.59 | 1.10 | (0.54%) |
| 10 | Boeing Co | BA | 3.852473 | 196.57 | 0.93 | (0.48%) |
| 11 | Honeywell International Inc | HON | 3.718359 | 189.95 | 2.06 | (1.10%) |
| 12 | Apple Inc | AAPL | 3.412534 | 172.54 | 0.58 | (0.34%) |
| 13 | Chevron Corp | CVX | 3.269699 | 168.56 | 0.76 | (0.45%) |
| 14 | Travelers Cos Inc | TRV | 3.252838 | 168.67 | 0.71 | (0.42%) |
| 15 | Walmart Inc | WMT | 3.160392 | 162.80 | 0.30 | (0.18%) |
| 16 | Johnson & Johnson | JNJ | 3.105933 | 158.58 | -0.45 | (-0.28%) |
| 17 | American Express Co | AXP | 2.969687 | 151.86 | 0.74 | (0.49%) |
| 18 | Procter & Gamble Co | PG | 2.919879 | 149.34 | 0.02 | (0.01%) |
| 19 | Intl Business Machines Corp | IBM | 2.838868 | 143.66 | 0.42 | (0.29%) |
| 20 | Jpmorgan Chase & Co | JPM | 2.838287 | 145.61 | 0.68 | (0.47%) |
| 21 | Merck & Co. Inc. | MRK | 2.051241 | 105.75 | 0.36 | (0.34%) |
| 22 | 3m Co | MMM | 1.837086 | 94.34 | 0.46 | (0.48%) |
| 23 | Nike Inc | NKE | 1.755881 | 90.59 | 0.42 | (0.46%) |
| 24 | Walt Disney Co | DIS | 1.570021 | 80.37 | 0.32 | (0.40%) |
| 25 | Coca Cola Co | KO | 1.104693 | 56.59 | 0.06 | (0.11%) |
| 26 | Cisco Systems Inc | CSCO | 1.036474 | 52.85 | 0.14 | (0.27%) |
| 27 | Dow Inc | DOW | 0.990154 | 50.70 | 0.22 | (0.44%) |
| 28 | Intel Corp | INTC | 0.66456 | 33.95 | 0.12 | (0.37%) |
| 29 | Verizon Communications Inc | VZ | 0.64266 | 33.07 | 0.08 | (0.24%) |
| 30 | Walgreens Boots Alliance Inc | WBA | 0.413582 | 21.19 | 0.06 | (0.26%) |
Significance of the Dow Jones Industrial Average
The Dow Jones Industrial Average is widely regarded as a barometer of the U.S. stock market’s health and a key indicator of economic trends. Many investors and financial professionals use the Dow as a reference point for assessing market conditions, making investment decisions, and gauging the overall economic sentiment.
Dow Jones Chart
A Dow Jones chart is a graphical representation of the index’s historical performance over time. These charts are invaluable tools for investors, analysts, and traders who want to visualize trends, identify patterns, and make informed investment decisions.
Dow Jones charts can be found in various forms, including line charts, bar charts, and candlestick charts, and can cover different timeframes, from minutes to decades.
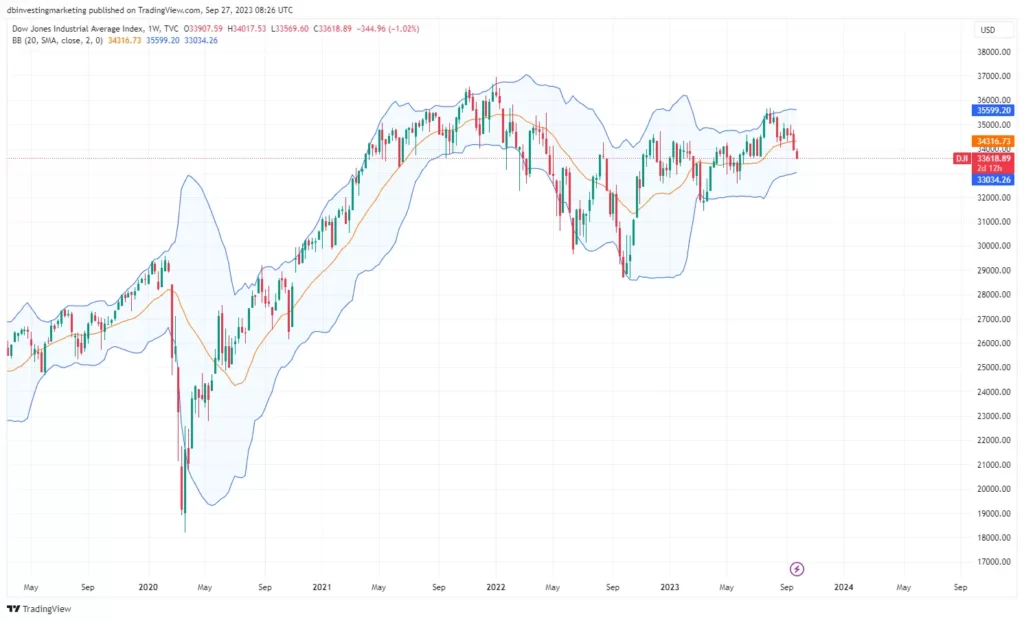
How to Interpret Dow Jones Charts
Interpreting Dow Jones charts involves analyzing price movements, identifying support and resistance levels, and using technical indicators to make predictions about future price movements. Traders and investors often look for trends, chart patterns (such as head and shoulders, double tops, and flags), and key levels to make trading decisions.
Dow Jones and Economic Events
The Dow Jones Industrial Average can be significantly influenced by economic events and news releases. Events such as Federal Reserve announcements, employment reports, corporate earnings, and geopolitical developments can lead to rapid fluctuations in the index. Understanding how these events impact the Dow is crucial for investors.
Conclusion
The Dow Jones Industrial Average is a venerable index with a long history of tracking the performance of the U.S. stock market. It remains a critical benchmark for investors and financial professionals worldwide.
Understanding its history, composition, and significance, as well as how to interpret Dow Jones charts, is essential for anyone looking to navigate the complex world of finance and investments.