Trading indicators are essential tools used by traders to analyze market trends, identify potential entry and exit points, and determine optimal trading strategies.
With the vast range of trading indicators available, it can be overwhelming for traders to choose which ones to use. In this article, we will explore the top 5 most popular trading indicators in 2023, their features, and how to use them effectively.
Moving Averages
Moving averages (MA) are one of the most widely used indicators in trading. They are calculated by averaging the price of an asset over a specified period, usually the past 20, 50, or 200 periods. MAs help traders identify the direction and strength of a trend and potential support or resistance levels.
There are two main types of moving averages: Simple Moving Average (SMA) and Exponential Moving Average (EMA). SMA calculates the average price of an asset over a specified period, while EMA gives more weight to recent prices. As a result, EMA reacts more quickly to price changes than SMA.
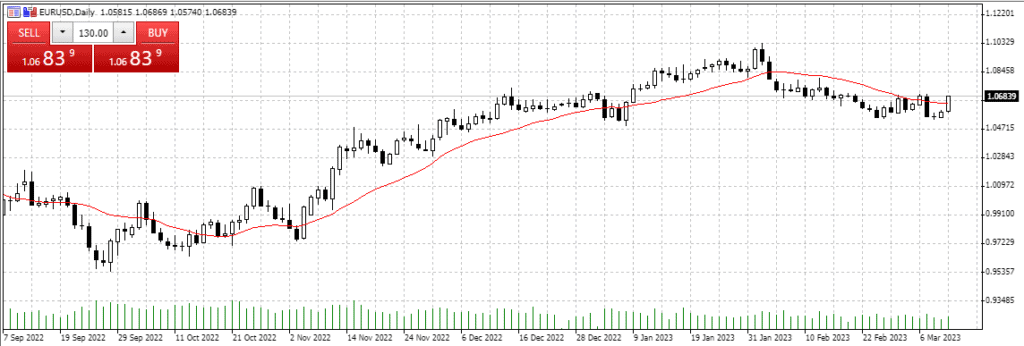
How to use Moving Averages:
- Identify the direction of the trend: Traders can use MAs to determine the direction of a trend by observing whether the price is above or below the moving average line. If the price is above the MA line, it indicates an uptrend, while a price below the MA line suggests a downtrend.
- Identify potential support and resistance levels: MAs can also act as support or resistance levels. If the price is approaching an MA line from below, it may bounce off the line, indicating a potential support level. On the other hand, if the price is approaching an MA line from above, it may act as a resistance level.
- Identify crossovers: Traders can use the crossover of two MAs to identify potential entry and exit points. A bullish crossover occurs when a short-term MA crosses above a long-term MA, indicating a buy signal. A bearish crossover occurs when a short-term MA crosses below a long-term MA, indicating a sell signal.
Relative Strength Index (RSI)
The Relative Strength Index (RSI) is a momentum indicator that measures the strength of an asset’s price movement. It ranges from 0 to 100 and is typically calculated over a 14-period timeframe. RSI is a popular indicator for identifying overbought and oversold conditions.
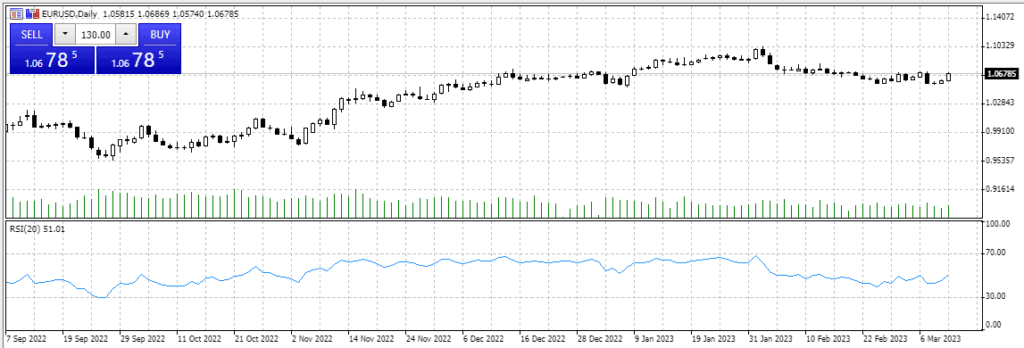
How to use RSI:
- Identify overbought and oversold conditions: When RSI rises above 70, it indicates that the asset is overbought and may be due for a price correction. Conversely, when RSI falls below 30, it indicates that the asset is oversold and may be due for a price rebound.
- Identify bullish and bearish divergences: Traders can also use RSI to identify potential trend reversals by looking for bullish or bearish divergences. A bullish divergence occurs when RSI makes a higher low while the asset’s price makes a lower low. It suggests that the asset may be due for a price increase. A bearish divergence occurs when RSI makes a lower high while the asset’s price makes a higher high, indicating a potential price decrease.
Bollinger Bands
Bollinger Bands are a popular technical indicator that measures volatility and identifies potential support and resistance levels. The indicator consists of three lines: a moving average line in the middle, and an upper and lower band that are two standard deviations away from the moving average.
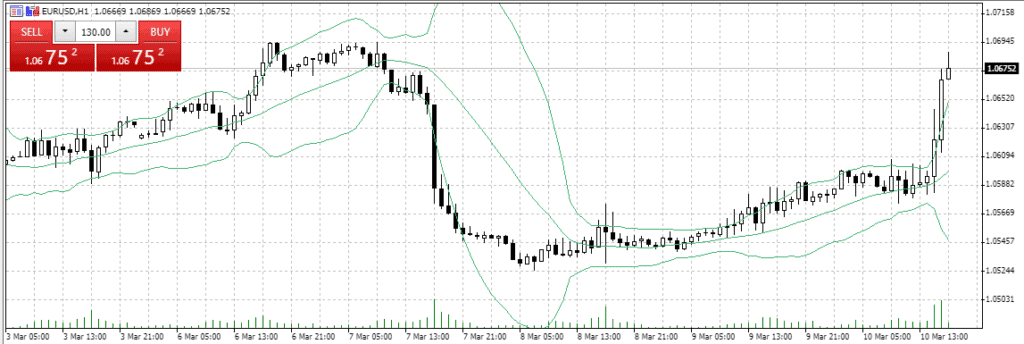
How to use Bollinger Bands:
- Identify overbought and oversold conditions: When the asset’s price reaches the upper band, it indicates that the asset is overbought and may be due for a price correction. Conversely, when the price reaches the lower band, it indicates that the asset is oversold and may be due for a price rebound.
- Identify trend reversals: Traders can also use Bollinger Bands to identify potential trend reversals. When the asset’s price breaks out of the upper or lower band, it suggests that the trend may be changing direction.
- Identify potential support and resistance levels: The middle line of the Bollinger Bands acts as a moving average and can also act as a support or resistance level.
Stochastic Oscillator
The Stochastic Oscillator is a momentum indicator that compares the closing price of an asset to its price range over a specified period, typically 14 periods. The indicator ranges from 0 to 100 and is used to identify overbought and oversold conditions.
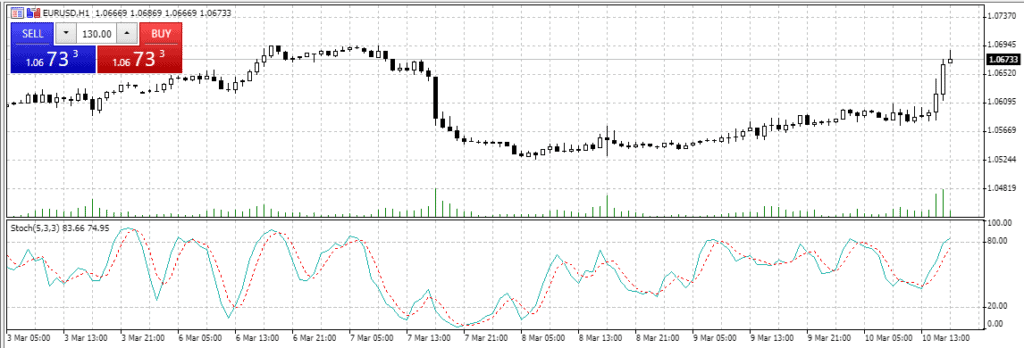
How to use Stochastic Oscillator:
- Identify overbought and oversold conditions: When the Stochastic Oscillator rises above 80, it indicates that the asset is overbought and may be due for a price correction. Conversely, when the oscillator falls below 20, it indicates that the asset is oversold and may be due for a price rebound.
- Identify bullish and bearish divergences: Traders can also use the Stochastic Oscillator to identify potential trend reversals by looking for bullish or bearish divergences. A bullish divergence occurs when the oscillator makes a higher low while the asset’s price makes a lower low. It suggests that the asset may be due for a price increase. A bearish divergence occurs when the oscillator makes a lower high while the asset’s price makes a higher high, indicating a potential price decrease.
Fibonacci Retracement
Fibonacci Retracement is a popular technical analysis tool used to identify potential support and resistance levels. It is based on the Fibonacci sequence, a mathematical sequence in which each number is the sum of the two preceding numbers.
The retracement levels are calculated by identifying the high and low points of a trend and dividing the vertical distance by the key Fibonacci ratios of 23.6%, 38.2%, 50%, 61.8%, and 100%.
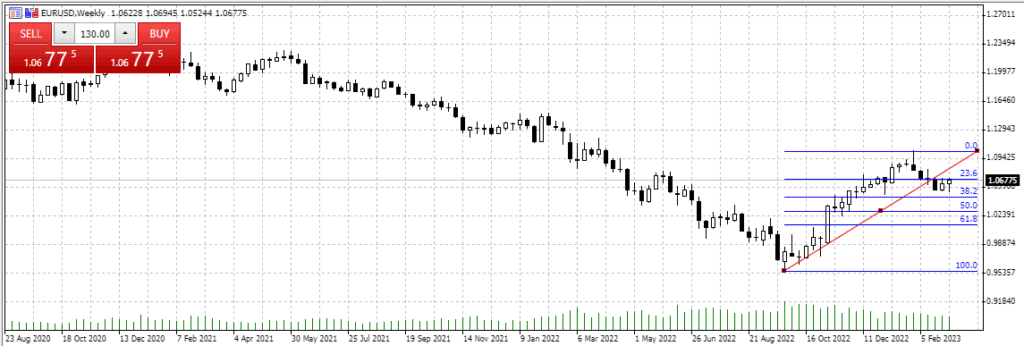
How to use Fibonacci Retracement:
- Identify potential support and resistance levels: Traders can use the Fibonacci retracement levels to identify potential support and resistance levels. When the asset’s price retraces to one of the Fibonacci levels, it may act as a support or resistance level, depending on the direction of the trend.
- Identify potential entry and exit points: Traders can also use the Fibonacci retracement levels to identify potential entry and exit points. A buy signal may occur when the asset’s price retraces to a Fibonacci level and then bounces back up. Conversely, a sell signal may occur when the asset’s price retraces to a Fibonacci level and then bounces back down.
Conclusion
Trading indicators play a crucial role in technical analysis and can significantly improve a trader’s strategy. In this article, we have explored the top 5 most popular trading indicators in 2023, their features, and how to use them effectively.
Moving averages, Relative Strength Index, Bollinger Bands, Stochastic Oscillator, and Fibonacci Retracement are versatile indicators that can be used in combination to provide a more comprehensive analysis of market trends and potential trading opportunities.
As with any trading strategy, it is essential to conduct thorough research, practice, and risk management to ensure long-term success.