Analyzing forex charts is an essential skill for traders looking to make profitable trades in the foreign exchange market. By understanding how to read and interpret forex charts, traders can identify trends, patterns, and key levels of support and resistance that can inform their trading decisions.
In this comprehensive guide, we’ll take a closer look at how to analyze forex charts like a pro. We’ll cover everything from understanding chart types to using technical indicators, so you’ll have all the knowledge you need to make informed trading decisions.
Understanding Forex Charts
Forex charts provide a visual representation of the price movements of currency pairs over time. There are several different types of forex charts, including line charts, bar charts, and candlestick charts.
Line Charts
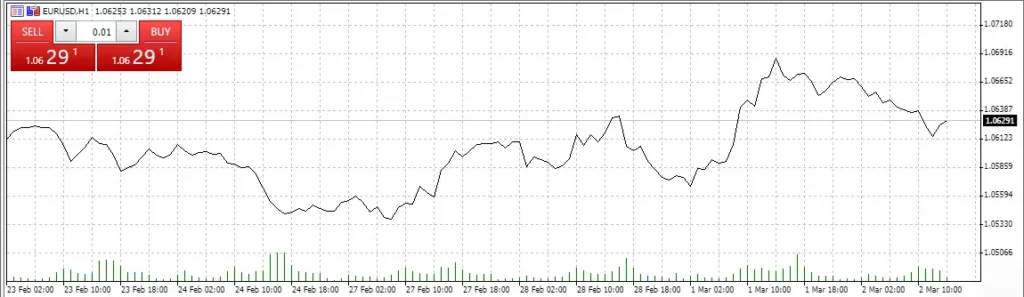
Line charts are the simplest type of forex chart and are created by connecting the closing prices of a currency pair over a set period of time. Line charts provide a basic overview of a currency pair’s price movements, but they don’t provide as much detail as other chart types.
Bar Charts
Bar charts provide more detailed information than line charts and include the high, low, open, and close prices of a currency pair for a given time period. Each bar on the chart represents a specific time period, such as one hour or one day.

Candlestick Charts
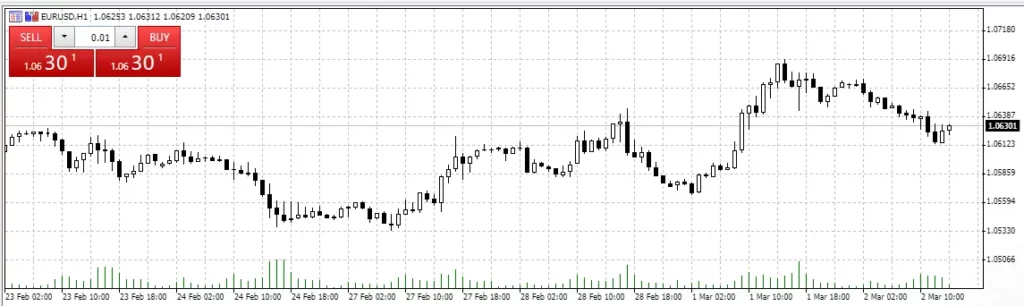
Candlestick charts are the most popular type of forex chart and are often used by professional traders. Like bar charts, they include the high, low, open, and close prices of a currency pair for a given time period. However, candlestick charts are easier to read and provide more information than bar charts.
Candlestick charts use colored bars, called candlesticks, to represent the price movements of a currency pair. A green or white candlestick indicates that the price of the currency pair has risen, while a red or black candlestick indicates that the price has fallen.
Using Technical Indicators
Technical indicators are tools that traders use to analyze forex charts and identify trends and patterns that can inform their trading decisions. There are many different technical indicators, but some of the most popular ones include moving averages, relative strength index (RSI), and Fibonacci retracement levels.
Moving Averages
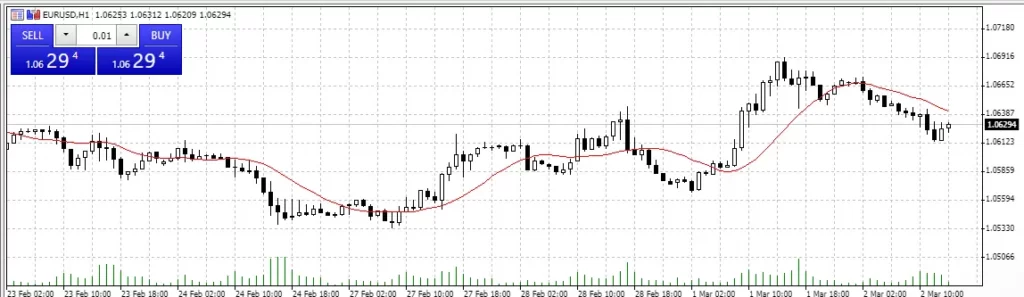
Moving averages are one of the most popular technical indicators and are used to identify trends in the price movements of a currency pair. A moving average is calculated by averaging the closing prices of a currency pair over a set period of time, such as 50 or 200 days.
Traders use moving averages to identify the direction of a trend. If the price of a currency pair is above the moving average, it’s considered to be in an uptrend, while if it’s below the moving average, it’s considered to be in a downtrend.
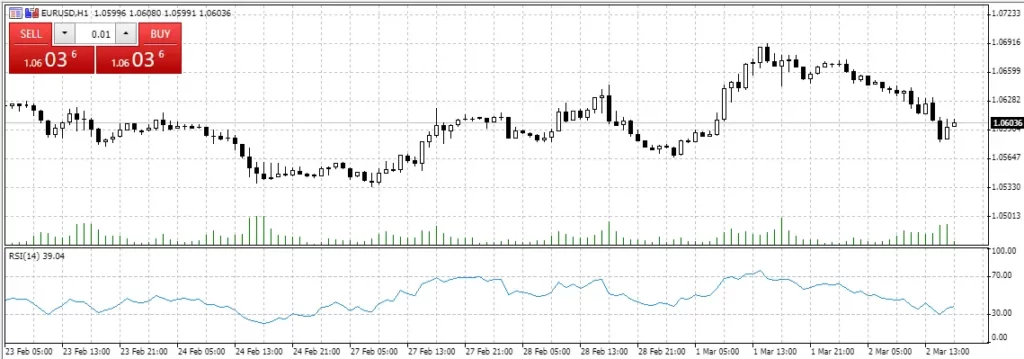
Relative Strength Index (RSI)
The relative strength index (RSI) is another popular technical indicator that’s used to identify overbought or oversold conditions in a currency pair. The RSI is calculated by comparing the average gains and losses of a currency pair over a set period of time.
Traders use the RSI to identify when a currency pair is overbought or oversold. If the RSI is above 70, it’s considered to be overbought, while if it’s below 30, it’s considered to be oversold.
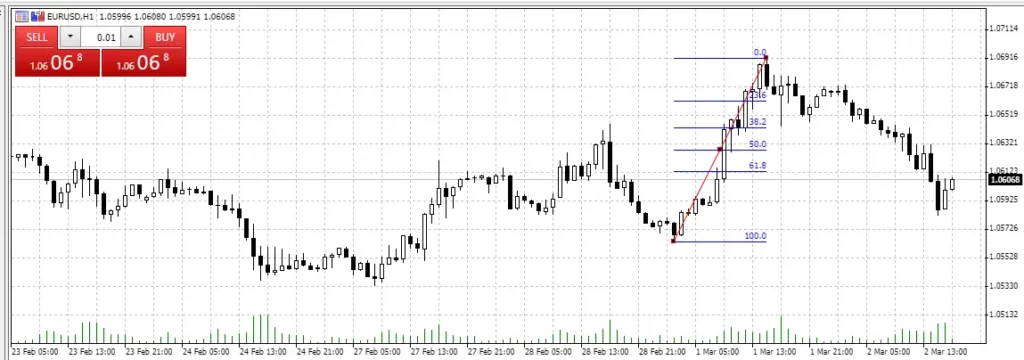
Fibonacci Retracement Levels
Fibonacci retracement levels are a popular tool used by traders to identify potential levels of support and resistance in a currency pair. Fibonacci retracement levels are based on the Fibonacci sequence and are calculated by identifying the high and low points of a currency pair and then applying Fibonacci ratios to determine potential support and resistance levels.
Traders use Fibonacci retracement levels to identify potential entry and exit points for their trades. For example, if a currency pair is in an uptrend and retraces to a Fibonacci retracement level, it may provide a buying opportunity for traders.
Other Technical Indicators
There are many other technical indicators that traders use to analyze forex charts, including moving average convergence divergence (MACD), Bollinger Bands, and stochastic oscillators. Each indicator provides different insights into the price movements of a currency pair and can be used in combination with other indicators to develop a comprehensive trading strategy.
Using Fundamental Analysis
In addition to technical analysis, traders also use fundamental analysis to analyze forex charts and identify potential trading opportunities. Fundamental analysis involves examining economic, financial, and other qualitative and quantitative factors that may influence the price movements of a currency pair.
Some of the key factors that traders consider when using fundamental analysis include:
- Economic indicators, such as gross domestic product (GDP), inflation, and interest rates
- Political and geopolitical events, such as elections and international conflicts
- Central bank policies, such as monetary policy and interest rate decisions
- Market sentiment, such as investor confidence and risk appetite
By combining technical and fundamental analysis, traders can develop a more comprehensive understanding of the price movements of a currency pair and make more informed trading decisions.

Conclusion
Analyzing forex charts is an essential skill for traders looking to make profitable trades in the foreign exchange market. By understanding how to read and interpret forex charts, traders can identify trends, patterns, and key levels of support and resistance that can inform their trading decisions.
In this comprehensive guide, we’ve covered everything from understanding chart types to using technical indicators and fundamental analysis. By using these tools and techniques, traders can develop a comprehensive trading strategy that takes into account both the technical and fundamental factors that influence the price movements of a currency pair.