
International Business Machines Corporation, commonly known as IBM, is a renowned American multinational technology company with a storied history dating back to its founding in 1911. Over the years, IBM has evolved into a global leader in information technology, providing a wide range of products and services.
In this comprehensive article, we will delve into various aspects of IBM, including its stock performance, dividends, earnings, headquarters, market capitalization, and stock price forecast.
IBM Overview
IBM, headquartered in Armonk, New York, is one of the oldest and most influential tech companies in the world. The company operates in multiple segments, including Cloud & Cognitive Software, Global Business Services, Global Technology Services, Systems, and Global Financing.
IBM’s contributions to the tech industry have been transformative, from the invention of the ATM to the development of the first computer capable of running software.
IBM Stock
IBM’s stock is listed on the New York Stock Exchange under the ticker symbol “IBM.” It is also a component of several major stock market indices, including the S&P 500. Investors and analysts closely monitor IBM’s stock performance as it reflects the company’s financial health and market sentiment.
IBM is a component of the Dow Jones Industrial Average (DJIA).
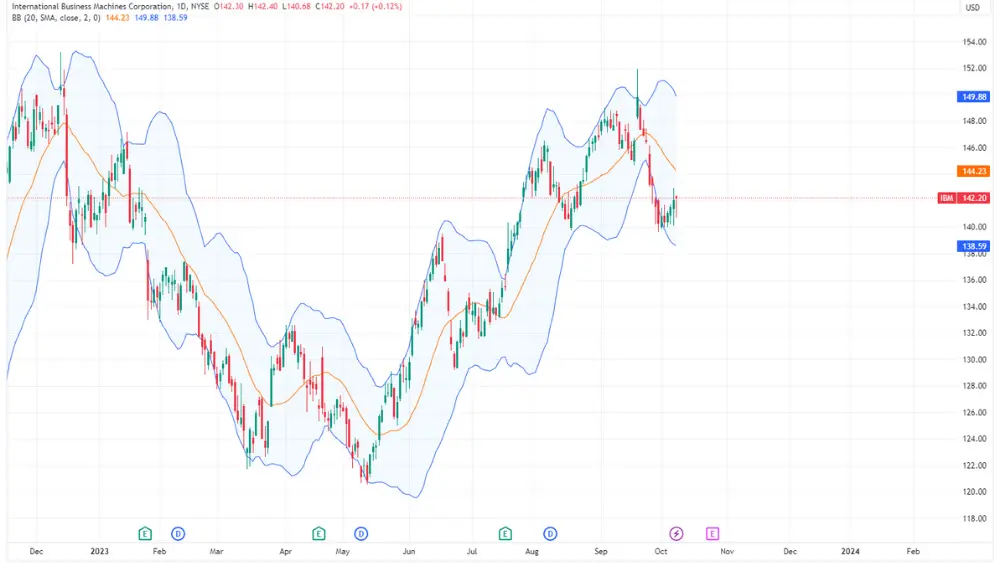
IBM Stock Price
The stock price of IBM fluctuates daily based on various factors, including market conditions, company news, and economic trends. To get the most up-to-date IBM stock price, you can check financial news websites, stock market apps, or IBM’s official investor relations page.
IBM Stock Price Forecast
Forecasting a stock’s future price is a complex task that involves analyzing a wide range of factors, including market trends, economic conditions, and company-specific factors. Analysts and financial experts often provide stock price forecasts, but these predictions are subject to change as new information becomes available.
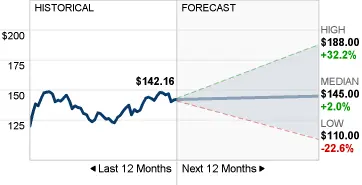
Fifteen analysts have provided their 12-month price forecasts for International Business Machines Corp (IBM). The consensus among these analysts is a median target price of $145.00. This consensus includes a high estimate of $188.00 and a low estimate of $110.00.
The median estimate of $145.00 suggests a modest increase of +2.00% from IBM’s recent closing price of $142.16.
IBM Market Cap
Market capitalization, often referred to as market cap, is a measure of a company’s total market value. It is calculated by multiplying the current stock price by the total number of outstanding shares. IBM’s market cap is a key indicator of its size and standing in the stock market.
Current market cap is $129.54B.
IBM Dividend
IBM has a history of paying dividends to its shareholders. Dividends are typically paid quarterly and provide investors with a portion of the company’s profits. IBM’s dividend yield and payout ratio are important metrics for income-focused investors. The dividend payout history can be found on IBM’s investor relations website.
IBM Dividend History
- EX-DIVIDEND DATE 08/09/2023
- DIVIDEND YIELD 4.68%
- ANNUAL DIVIDEND $6.64
- P/E RATIO 65.83
| Ex/EFF DATE | TYPE | CASH AMOUNT | DECLARATION DATE | RECORD DATE | PAYMENT DATE |
|---|---|---|---|---|---|
| 08/09/2023 | CASH | $1.66 | 07/24/2023 | 08/10/2023 | 09/09/2023 |
| 05/09/2023 | CASH | $1.66 | 04/25/2023 | 05/10/2023 | 06/10/2023 |
| 02/09/2023 | CASH | $1.65 | 01/31/2023 | 02/10/2023 | 03/10/2023 |
| 11/09/2022 | CASH | $1.65 | 10/25/2022 | 11/10/2022 | 12/10/2022 |
| 08/09/2022 | CASH | $1.65 | 07/25/2022 | 08/10/2022 | 09/10/2022 |
| 05/09/2022 | CASH | $1.65 | 04/26/2022 | 05/10/2022 | 06/10/2022 |
| 02/10/2022 | CASH | $1.64 | 02/01/2022 | 02/11/2022 | 03/10/2022 |
| 11/09/2021 | CASH | $1.64 | 10/26/2021 | 11/10/2021 | 12/10/2021 |
| 08/09/2021 | CASH | $1.64 | 07/27/2021 | 08/10/2021 | 09/10/2021 |
| 05/07/2021 | CASH | $1.64 | 04/27/2021 | 05/10/2021 | 06/10/2021 |
| 02/09/2021 | CASH | $1.63 | 01/26/2021 | 02/10/2021 | 03/10/2021 |
IBM Earnings
Earnings reports, which are typically released quarterly, provide insights into IBM’s financial performance. These reports include revenue, net income, earnings per share (EPS), and other key financial metrics. Investors and analysts closely analyze these earnings reports to assess the company’s growth and profitability.
Second-Quarter Highlights
- Revenue
– Revenue of $15.5 billion, down 0.4 percent, up 0.4 percent at constant currency
– Software revenue up 7 percent, up 8 percent at constant currency
– Consulting revenue up 4 percent, up 6 percent at constant currency
– Infrastructure revenue down 15 percent, down 14 percent at constant currency
- Profit Margin
– Gross Profit Margin: GAAP: 54.9 percent, up 160 basis points; Operating (Non-GAAP): 55.9 percent, up 140 basis points
– Pre-Tax Income Margin: GAAP: 12.9 percent, up 180 basis points; Operating (Non-GAAP): 15.5 percent, down 70 basis points
- Cash Flow
– Year to date net cash from operating activities of $6.4 billion, up $1.8 billion; free cash flow of $3.4 billion, up $0.1 billion
IBM Headquarters
IBM’s global headquarters is located in Armonk, New York. This modern campus serves as the central hub for the company’s executive leadership and research and development efforts. IBM’s commitment to innovation is evident through its various research facilities and partnerships worldwide.
Conclusion
IBM remains a significant player in the technology industry, with a rich history of innovation and adaptation. Investors interested in IBM stock should carefully analyze its performance, dividends, earnings, and market cap, while also considering the company’s strategic direction and competitive position.
Keep in mind that stock price forecasts are speculative and should be approached with caution. To make informed investment decisions, consider consulting with a financial advisor and conducting thorough research on IBM and the broader market.