
Amazon (AMZN) has been one of the most influential and lucrative stocks in the market over the past few decades. Founded by Jeff Bezos in 1994, the company has transformed from an online bookstore to an e-commerce giant, with its services now spanning various sectors, including cloud computing, digital streaming, and artificial intelligence.
Amazon Stock History
Since its initial public offering (IPO) on May 15, 1997, at $18 per share, Amazon’s stock has experienced remarkable growth, surpassing many milestones along the way. Its stock price has seen significant fluctuations over the years, responding to market dynamics, company announcements, and global economic trends.
Amazon Stock Split
One significant event that caught the attention of investors was Amazon’s decision to split its stock. In 2020, the company announced a 5-for-1 stock split, a move aimed at making its shares more accessible to a broader investor base.
The split increased the number of outstanding shares but decreased the share price proportionally, thereby enhancing liquidity and potentially attracting more investors.
AMZN Forecast
Market analysts and financial experts have closely monitored Amazon’s performance and growth trajectory, offering various forecasts for its stock. With the company’s continuous expansion into diverse sectors and the significant role it plays in e-commerce globally, many analysts remain bullish about its future prospects.
However, some caution about the potential impact of market competition, regulatory challenges, and global economic uncertainties on its stock value.
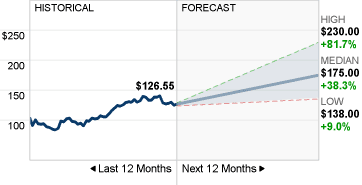
46 analysts have provided their 12-month price forecasts for Amazon.com Inc. The median target stands at 175.00, with the highest estimate at 230.00 and the lowest at 138.00. This suggests a potential increase of 38.29% from the last recorded price of 126.55.
Amazon Stock Chart Analysis
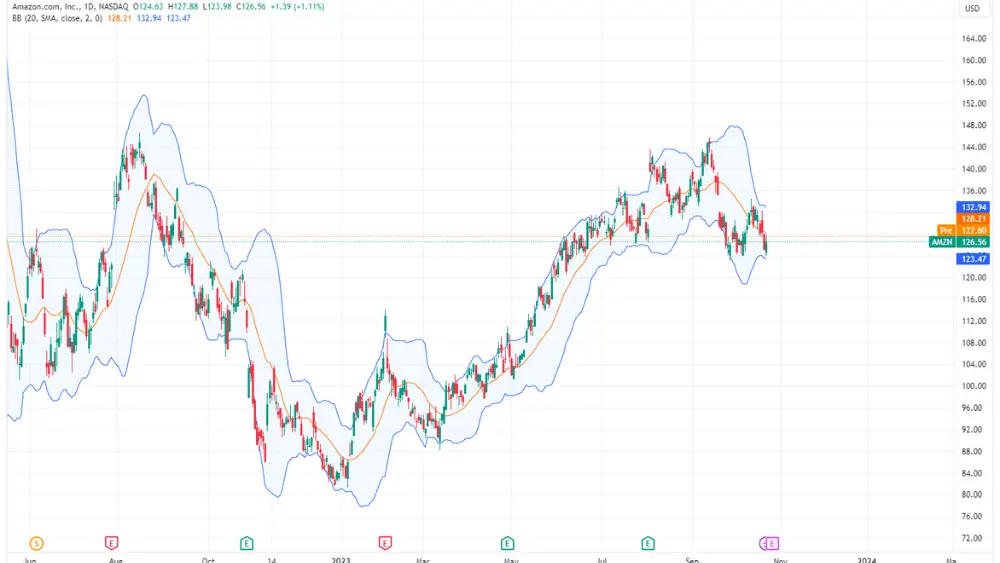
Examining the historical performance of Amazon’s stock through a detailed analysis of its stock chart reveals patterns and trends that can provide valuable insights for investors. Despite occasional fluctuations, the overall trend has been upward, reflecting the company’s resilience and ability to adapt to changing market dynamics.
Amazon is a component of the Nasdaq 100 (US 100).
AMZN Stock Earnings
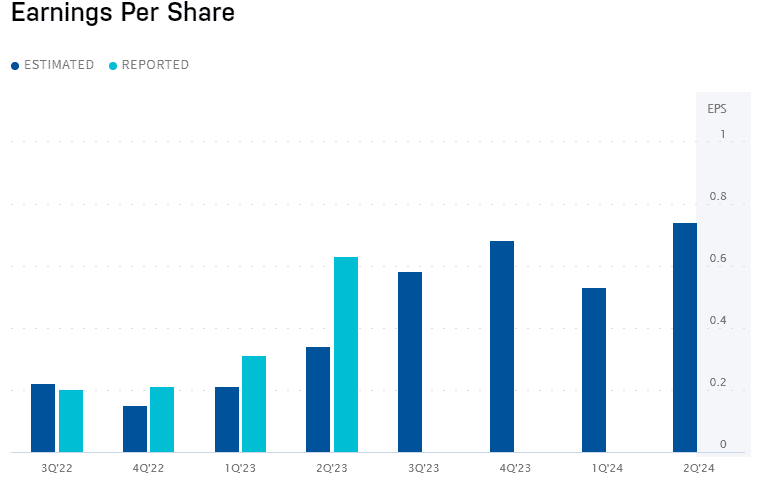
Amazon’s earnings reports have consistently been a focal point for investors, analysts, and the media. The company’s financial statements showcase its revenue, net income, operating cash flow, and other critical financial metrics.
Amazon’s ability to consistently deliver strong earnings results, often exceeding market expectations, has contributed to the sustained confidence of its investors.
Conclusion
As of the latest update, Amazon continues to demonstrate robust performance and innovative strategies, maintaining its position as a market leader. However, investors should remain mindful of potential risks associated with market volatility and the evolving regulatory landscape.
With its strong fundamentals, diverse revenue streams, and continuous innovation, Amazon appears well-positioned for future growth, making it a stock to watch in the dynamic world of e-commerce and technology.