The Nasdaq, an American stock exchange, has a storied history that has significantly shaped the modern financial landscape. From its inception to the establishment of key indices like the Nasdaq 100 and the Nasdaq Composite, the exchange has played a pivotal role in the global economy.
This article provides an in-depth exploration of the history and evolution of the Nasdaq index, an analysis of the Nasdaq 100, a breakdown of the Nasdaq Composite index, an overview of the companies listed on the Nasdaq 100, and a glimpse into the Nasdaq 100 price chart.
History of the nasdaq index
The Nasdaq Index, a vital indicator of the performance of technology and growth companies, has a rich history that mirrors the evolution of the global economy. The roots of this index can be traced back to the early 1970s when the world was witnessing a rapid transformation in the field of technology and finance.
The Nasdaq, short for the National Association of Securities Dealers Automated Quotations, has played a significant role in shaping the global financial landscape. Let’s delve into the comprehensive history of the Nasdaq Index, highlighting its key milestones and pivotal moments that have defined its trajectory over the decades.
Genesis and Early Years (1971-1990)
The Nasdaq’s story began in 1971 when the National Association of Securities Dealers (NASD) created the world’s first electronic stock market. Initially, it operated as a quotation system providing automated and efficient trading for Over-The-Counter (OTC) stocks.
As the 1980s dawned, the Nasdaq started gaining prominence as a platform for technology companies to raise capital, becoming an essential player in the growth of the technology sector. This period marked the nascent stages of the Nasdaq’s journey toward becoming a symbol of the tech industry’s dynamism and innovation.
Technological Advancements and Dotcom Boom (1990-2000)
The 1990s were a defining era for the Nasdaq. As technology continued to advance at a rapid pace, the Nasdaq became the preferred platform for many tech startups and established firms to go public. The dotcom boom of the late 1990s saw the Nasdaq soar to unprecedented heights, driven by the frenzy surrounding internet-based companies.
The index experienced exponential growth, reaching its peak in March 2000. However, the subsequent burst of the dotcom bubble led to a significant market correction, causing the Nasdaq to plummet, resulting in a period of volatility and uncertainty.
Resilience and Diversification (2000-2010)
The early 2000s proved to be a testing time for the Nasdaq as it grappled with the aftermath of the dotcom crash. Despite the challenges, the index demonstrated resilience and adaptability. The Nasdaq diversified its listings, expanding beyond the technology sector to include biotechnology, financial, and industrial companies.
This diversification strategy helped in stabilizing the index and broadening its influence in the global financial market. It also paved the way for the Nasdaq to regain its footing and emerge as a resilient force in the post-dotcom era.
Modern Era and Global Expansion (2010-Present)
Entering the modern era, the Nasdaq has continued to evolve, adapting to the changing dynamics of the global economy. The index has solidified its position as a benchmark for the performance of leading technology and growth companies worldwide. Its global expansion has led to the inclusion of numerous international companies, further enhancing its status as a crucial barometer of the tech-driven economy.
Additionally, the Nasdaq’s role in facilitating the listing of numerous high-profile tech giants has underscored its significance in the contemporary financial landscape.
The history of the Nasdaq Index is a testament to the transformative power of technology and innovation in shaping the global financial ecosystem. From its humble beginnings as an electronic quotation system to its current stature as a global symbol of technological prowess, the Nasdaq has weathered various storms, demonstrating its resilience and adaptability.
As we look to the future, the Nasdaq is poised to remain a key player in the ever-evolving world of finance, reflecting the continuous evolution of the technology sector and its impact on global markets.
Nasdaq 100 Companies
| # | Company | Symbol | Weight | Price | Chg | % Chg |
|---|---|---|---|---|---|---|
| 1 | Apple Inc | AAPL | 11.041 |  173.00 173.00 | 0.12 | (0.07%) |
| 2 | Microsoft Corp | MSFT | 9.914 | 329.32 | 2.65 | (0.81%) |
| 3 | Amazon.com Inc | AMZN | 5.276 | 126.55 | 1.38 | (1.10%) |
| 4 | NVIDIA Corp | NVDA | 4.176 | 429.75 | 15.88 | (3.84%) |
| 5 | Meta Platforms Inc | META | 3.928 | 314.01 | 5.36 | (1.74%) |
| 6 | Alphabet Inc | GOOGL | 3.286 | 136.50 | 0.90 | (0.66%) |
| 7 | Alphabet Inc | GOOG | 3.24 | 137.90 | 1.16 | (0.85%) |
| 8 | Broadcom Inc | AVGO | 3.086 | 862.22 | 8.59 | (1.01%) |
| 9 | Tesla Inc | TSLA | 2.749 | 212.08 | 0.09 | (0.04%) |
| 10 | Adobe Inc | ADBE | 2.16 |  540.41 540.41 | -0.55 | (-0.10%) |
| 11 | Costco Wholesale Corp | COST | 2.148 | 552.29 | -0.64 | (-0.12%) |
| 12 | PepsiCo Inc | PEP | 1.93 | 160.09 | 0.09 | (0.06%) |
| 13 | Cisco Systems Inc | CSCO | 1.89 | 52.19 | -0.74 | (-1.40%) |
| 14 | Netflix Inc | NFLX | 1.557 | 406.84 | 5.88 | (1.47%) |
| 15 | Comcast Corp | CMCSA | 1.545 | 42.93 | 0.07 | (0.16%) |
| 16 | Advanced Micro Devices Inc | AMD | 1.441 | 100.01 | -1.80 | (-1.77%) |
| 17 | T-Mobile US Inc | TMUS | 1.412 | 137.74 | 0.75 | (0.55%) |
| 18 | Amgen Inc | AMGN | 1.307 | 273.00 | -5.81 | (-2.08%) |
| 19 | Intel Corp | INTC | 1.281 | 33.85 | -1.07 | (-3.06%) |
| 20 | Intuit Inc | INTU | 1.243 | 504.03 | -2.78 | (-0.55%) |
| 21 | Texas Instruments Inc | TXN | 1.176 | 146.32 | -1.49 | (-1.01%) |
| 22 | QUALCOMM Inc | QCOM | 1.062 | 108.65 | 0.02 | (0.02%) |
| 23 | Honeywell International Inc | HON | 1.055 | 180.52 | -0.80 | (-0.44%) |
| 24 | Applied Materials Inc | AMAT | 0.983 | 134.23 | 0.11 | (0.08%) |
| 25 | Starbucks Corp | SBUX | 0.945 | 94.20 | 0.01 | (0.01%) |
| 26 | Automatic Data Processing Inc | ADP | 0.872 | 241.16 | -0.52 | (-0.22%) |
| 27 | Booking Holdings Inc | BKNG | 0.862 | 2,819.54 | 62.90 | (2.28%) |
| 28 | Gilead Sciences Inc | GILD | 0.849 | 77.56 | -0.24 | (-0.31%) |
| 29 | Intuitive Surgical Inc | ISRG | 0.822 | 272.59 | 5.68 | (2.13%) |
| 30 | Vertex Pharmaceuticals Inc | VRTX | 0.818 | 367.66 | 5.80 | (1.60%) |
| 31 | Mondelez International Inc | MDLZ | 0.764 | 63.99 | -0.11 | (-0.17%) |
| 32 | Regeneron Pharmaceuticals Inc | REGN | 0.756 | 795.54 | -12.93 | (-1.60%) |
| 33 | Analog Devices Inc | ADI | 0.727 | 163.87 | -2.65 | (-1.59%) |
| 34 | Lam Research Corp | LRCX | 0.697 | 599.58 | -0.77 | (-0.13%) |
| 35 | Palo Alto Networks Inc | PANW | 0.651 | 246.17 | 3.07 | (1.26%) |
| 36 | Micron Technology Inc | MU | 0.645 | 66.88 | -0.34 | (-0.51%) |
| 37 | Synopsys Inc | SNPS | 0.623 | 467.82 | 0.18 | (0.04%) |
| 38 | PDD Holdings Inc | PDD | 0.587 | 104.19 | 1.41 | (1.37%) |
| 39 | Cadence Design Systems Inc | CDNS | 0.568 | 239.92 | 1.28 | (0.54%) |
| 40 | Charter Communications Inc | CHTR | 0.563 | 430.27 | 0.62 | (0.14%) |
| 41 | KLA Corp | KLAC | 0.554 | 462.73 | 0.29 | (0.06%) |
| 42 | CSX Corp | CSX | 0.541 | 30.16 | -0.60 | (-1.95%) |
| 43 | PayPal Holdings Inc | PYPL | 0.514 | 53.45 | 0.06 | (0.11%) |
| 44 | MercadoLibre Inc | MELI | 0.513 | 1,180.13 | 10.46 | (0.89%) |
| 45 | Marriott International Inc | MAR | 0.491 | 188.64 | 0.67 | (0.36%) |
| 46 | O’Reilly Automotive Inc | ORLY | 0.479 | 878.67 | -28.39 | (-3.13%) |
| 47 | Monster Beverage Corp | MNST | 0.459 | 50.30 | 0.32 | (0.64%) |
| 48 | Cintas Corp | CTAS | 0.444 | 499.48 | 1.29 | (0.26%) |
| 49 | ASML Holding NV | ASML | 0.441 | 587.79 | 7.69 | (1.33%) |
| 50 | Airbnb Inc | ABNB | 0.435 | 120.39 | 3.90 | (3.35%) |
| 51 | Lululemon Athletica Inc | LULU | 0.421 | 402.46 | 6.64 | (1.68%) |
| 52 | NXP Semiconductors NV | NXPI | 0.42 | 182.35 | -3.41 | (-1.84%) |
| 53 | Fortinet Inc | FTNT | 0.388 | 56.10 | -0.26 | (-0.46%) |
| 54 | Workday Inc | WDAY | 0.383 | 209.58 | -1.58 | (-0.75%) |
| 55 | Autodesk Inc | ADSK | 0.38 | 199.72 | -2.97 | (-1.47%) |
| 56 | Old Dominion Freight Line Inc | ODFL | 0.376 | 387.66 | -5.59 | (-1.42%) |
| 57 | Marvell Technology Inc | MRVL | 0.374 | 49.02 | -0.45 | (-0.91%) |
| 58 | PACCAR Inc | PCAR | 0.374 | 81.36 | -0.22 | (-0.27%) |
| 59 | Paychex Inc | PAYX | 0.366 | 116.63 | 0.63 | (0.54%) |
| 60 | Copart Inc | CPRT | 0.365 | 44.15 | 0.46 | (1.05%) |
| 61 | Microchip Technology Inc | MCHP | 0.359 | 74.39 | -0.97 | (-1.29%) |
| 62 | Seagen Inc | SGEN | 0.354 | 216.87 | 1.37 | (0.64%) |
| 63 | Crowdstrike Holdings Inc | CRWD | 0.354 | 179.08 | 0.32 | (0.18%) |
| 64 | Keurig Dr Pepper Inc | KDP | 0.351 | 28.33 | -0.32 | (-1.12%) |
| 65 | Ross Stores Inc | ROST | 0.345 | 114.41 | -1.25 | (-1.08%) |
| 66 | Exelon Corp | EXC | 0.343 | 38.40 | -0.90 | (-2.29%) |
| 67 | Kraft Heinz Co/The | KHC | 0.337 | 31.12 | -0.19 | (-0.61%) |
| 68 | American Electric Power Co Inc | AEP | 0.331 | 73.35 | 0.00 | (0.00%) |
| 69 | Biogen Inc | BIIB | 0.327 | 253.39 | -4.06 | (-1.58%) |
| 70 | AstraZeneca PLC ADR | AZN | 0.326 | 63.05 | -0.78 | (-1.22%) |
| 71 | ON Semiconductor Corp | ON | 0.321 | 83.61 | -1.22 | (-1.44%) |
| 72 | Constellation Energy Corp | CEG | 0.316 | 112.11 | 0.01 | (0.01%) |
| 73 | IDEXX Laboratories Inc | IDXX | 0.311 | 427.72 | 0.72 | (0.17%) |
| 74 | Baker Hughes Co | BKR | 0.308 | 34.67 | -0.17 | (-0.49%) |
| 75 | Electronic Arts Inc | EA | 0.302 | 126.34 | -1.10 | (-0.86%) |
| 76 | Verisk Analytics Inc | VRSK | 0.298 | 230.87 | -3.56 | (-1.52%) |
| 77 | Dexcom Inc | DXCM | 0.292 | 86.02 | 0.05 | (0.06%) |
| 78 | Cognizant Technology Solutions Corp | CTSH | 0.291 | 65.02 | -0.72 | (-1.10%) |
| 79 | Trade Desk Inc/The | TTD | 0.289 | 73.64 | -0.42 | (-0.57%) |
| 80 | Fastenal Co | FAST | 0.288 | 57.38 | -0.23 | (-0.40%) |
| 81 | Xcel Energy Inc | XEL | 0.281 | 58.05 | -0.05 | (-0.09%) |
| 82 | Moderna Inc | MRNA | 0.268 | 78.64 | -1.76 | (-2.19%) |
| 83 | CoStar Group Inc | CSGP | 0.264 | 73.25 | -0.59 | (-0.80%) |
| 84 | GLOBALFOUNDRIES Inc | GFS | 0.261 | 53.95 | -0.41 | (-0.75%) |
| 85 | Diamondback Energy Inc | FANG | 0.261 | 165.32 | -1.16 | (-0.70%) |
| 86 | GE HealthCare Technologies Inc | GEHC | 0.255 | 63.99 | -0.06 | (-0.09%) |
| 87 | Atlassian Corp | TEAM | 0.251 | 186.00 | -1.07 | (-0.57%) |
| 88 | Datadog Inc | DDOG | 0.226 | 85.68 | -0.40 | (-0.46%) |
| 89 | Warner Bros Discovery Inc | WBD | 0.221 | 10.14 | -0.19 | (-1.84%) |
| 90 | Dollar Tree Inc | DLTR | 0.213 | 108.97 | -1.56 | (-1.41%) |
| 91 | ANSYS Inc | ANSS | 0.213 | 275.94 | -3.78 | (-1.35%) |
| 92 | Zscaler Inc | ZS | 0.207 | 162.48 | 0.29 | (0.18%) |
| 93 | eBay Inc | EBAY | 0.19 | 40.17 | -0.59 | (-1.45%) |
| 94 | Align Technology Inc | ALGN | 0.181 | 265.72 | -4.16 | (-1.54%) |
| 95 | Illumina Inc | ILMN | 0.166 | 119.47 | -0.17 | (-0.14%) |
| 96 | Walgreens Boots Alliance Inc | WBA | 0.161 | 21.96 | 0.70 | (3.29%) |
| 97 | Sirius XM Holdings Inc | SIRI | 0.15 | 4.48 | 0.01 | (0.22%) |
| 98 | Zoom Video Communications Inc | ZM | 0.137 | 61.13 | -0.58 | (-0.94%) |
| 99 | Enphase Energy Inc | ENPH | 0.118 | 96.29 | -2.60 | (-2.63%) |
| 100 | JD.com Inc ADR | JD | 0.097 | 24.80 | 0.42 | (1.72%) |
| 101 | Lucid Group Inc | LCID | 0.085 | 4.34 | 0.06 | (1.40%) |
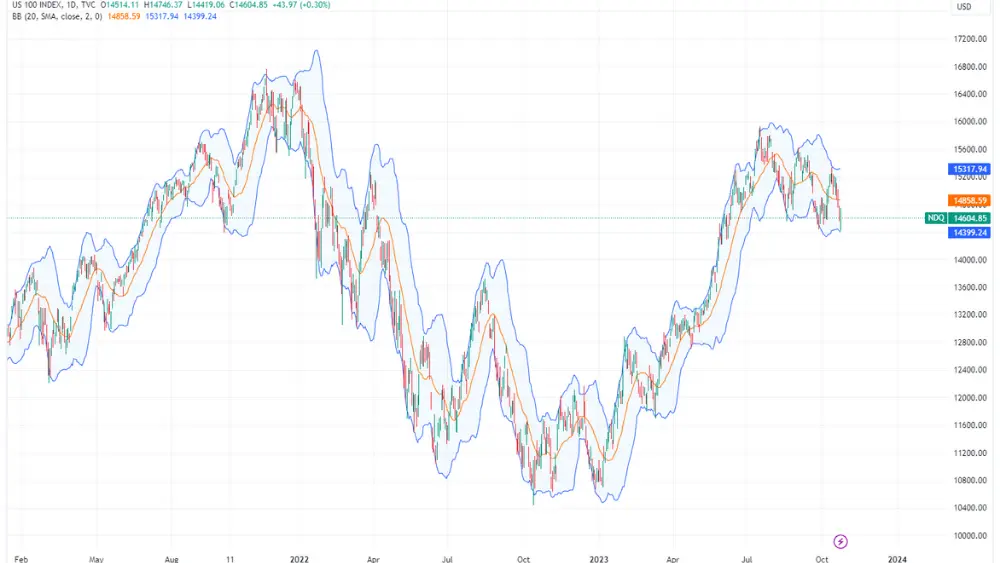
Nasdaq Index Chart
Chart Analysis Techniques
To effectively analyze the Nasdaq Index chart, investors and analysts often employ various technical analysis techniques. These techniques include trend analysis, moving averages, relative strength indicators, and Bollinger bands.
Each method provides unique insights into the market’s behavior, enabling investors to anticipate potential trends and market shifts.
Impact of Macroeconomic Factors
Macroeconomic factors, such as interest rates, inflation, and geopolitical events, significantly influence the Nasdaq Index. Understanding how these factors interact with the Index is crucial for predicting its movements.
For instance, changes in interest rates can affect the cost of borrowing for companies, which can, in turn, impact their stock prices and, consequently, the Nasdaq Index.
Volatility and Risk Management
Volatility is an inherent characteristic of the Nasdaq Index, primarily due to the nature of the companies it represents. Investors and fund managers often implement risk management strategies to mitigate the effects of market fluctuations.
These strategies may include diversification, hedging, and the use of derivatives to protect portfolios from potential downturns.