
EUR/USD pair
Since the twenty-eighth of December 2023 to this day, the euro has lost more than 530 points against the US dollar, with a change rate of 4.76%. During the past week, the euro closed against the US dollar with a slight reversal represented by a Doji candle on the weekly frame, which may suggest a price rebound in… upcoming periods. From the opening of the markets yesterday until this morning, The EUR/USD is still seeking to break the support area located at the levels of 1.06405 to the levels of 1.06142 dollars.
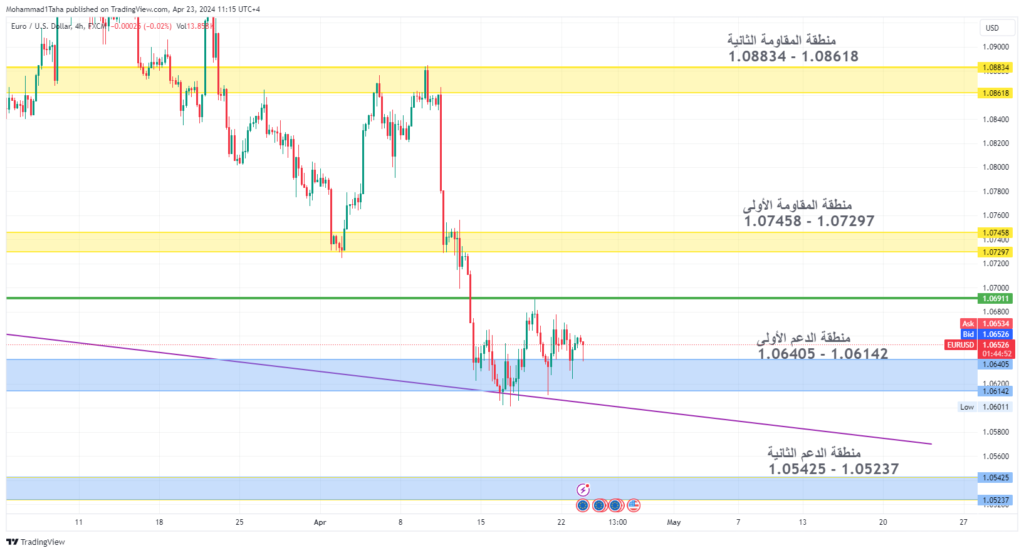
Four-hour chart of the EUR/USD pair:
On the four-hour time frame, The EUR/USD pair seeks to break the first support area located between the levels of 1.06405 up to the levels of 1.06142, and the pair appears in the form of a horizontal movement. In the event that the first support area is broken and closes below these levels, the next stop will be targeting the second support levels at the levels of 1.05425 up to 1.05237, and in the event of failure. If the pair breaks the first support levels, it is possible to rebound and retest the first resistance levels, and we will see a correction for some time. The sideways movement, as shown in the chart, indicates the presence of profit-taking and purchasing operations that led to price stability after the decline from the second resistance area, which amounted to 2.31%.
Focal point: 1.06899
First support area: 1.07458 – 1.07297
Second support area: 1.05425 – 1.05237
First resistance area: 1.07458 – 1.07297
Second resistance area: 1.08834 – 1.08618
GBP/USD pair
The pound sterling has lost against the US dollar since the fourteenth of February of this year until this day for more than 1089 points, with a change rate of 8.29%. During the past week, the pound sterling against the US dollar closed with a sharp decline represented by an engulfing candle on the weekly frame, which may suggest a continuation of the decline. Price in the coming period. From the opening of the markets yesterday until this morning, The pair fell to record the lowest price at 1.22992, and since dawn on Tuesday, the price has increased by 0.09% as of the writing of the article. But the prevailing trend is still down
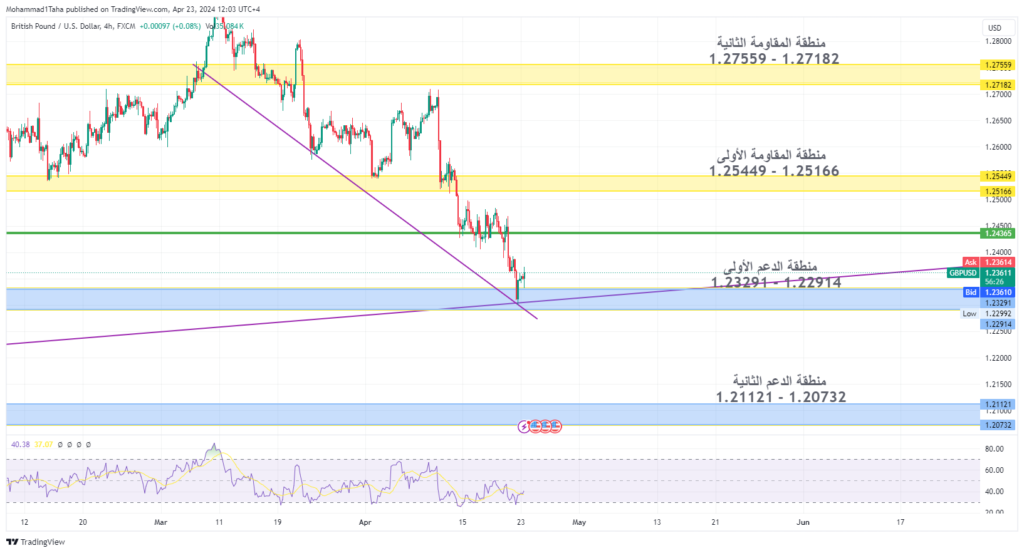
Four-hour chart of the British pound against the US dollar:
On the four-hour time frame, The GBPUSD pair seeks to break the first support area located between the levels of 1.23291 up to the levels of 1.22914, and the pair appears in the form of a rapid rebound from these levels, which is a natural movement as a first visit to these levels. In the event of breaking the first support area and closing below these levels, the next stop will be targeting the support levels. The second is at levels 1.21121 up to 1.20732. If the pair is unable to break the first support levels, it is possible to rebound and retest the first resistance levels and we will see a correction for some time. It appears that the price movement will continue to decline unless we see any corrections exceeding a hundred points
Focal point: 1.24365
First support area: 1.23291 – 1.22914
Second support area: 1.05425 – 1.05237
First resistance area: 1.25449 – 1.25166
Second resistance area: 1.21121 – 1.20732
The US dollar pair against the Japanese yen USD/JPY
The US dollar has gained against the Japanese yen since the twenty-fifth of January 2021 to this day for more than 5118 points, with a change rate of 49.39%. During the past week, the dollar and the yen closed at a strong rise, represented by a strong candle with no tails on the weekly frame, which may suggest continuation. To rise and reach new levels. From the opening of the markets yesterday until this morning, The dollar/yen is still seeking to break the support area located at 1.06405 levels to $1.06142 levels.
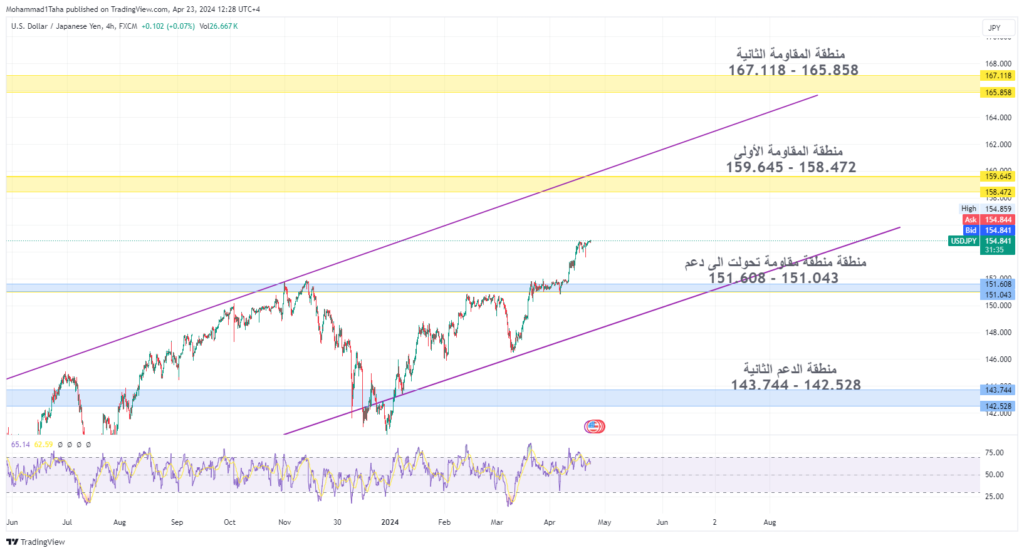
4-Hour USD/JPY Chart:
On the four-hour time frame, The USD/JPY pair seeks to target the first resistance area located between the levels of 158.472 up to the levels of 159.645, and the pair appears in the form of an upward movement so far, and since breaking the resistance area that turned into a support area, the price has not returned and tested it, and in this case one of the scenarios may be the return of the price. To test the breached area and retest it before continuing the rise. In the event that the first resistance area is broken and close above these levels, the next stop will be targeting the second support levels at levels 165.858 up to 167.118. In the event that the pair is unable to break the first resistance levels, it is possible to bounce back to the levels of the area. The first support, and if it is broken, the decline will continue to the second support levels
Pivotal point: 155.690
First support area: 151.608 – 151.043
Second support area: 143.744 – 142.528
First resistance area: 159.645 – 158.472
Second resistance area: 167.118 – 165.858
USOIL pair
Since the thirteenth of December last year until today, oil has gained more than 1,970 points against the US dollar, with a change rate of up to 29%. During the past week, oil closed on a sharp decline represented by an engulfing candle on the weekly frame, which may suggest a continuation of the price decline in the coming period. From the opening of the markets yesterday until this morning, Oil rose to record its lowest price at $80.79 per barrel, and since dawn on Tuesday, the price has increased by 0.47% as of the writing of the article. But the prevailing trend is still upward
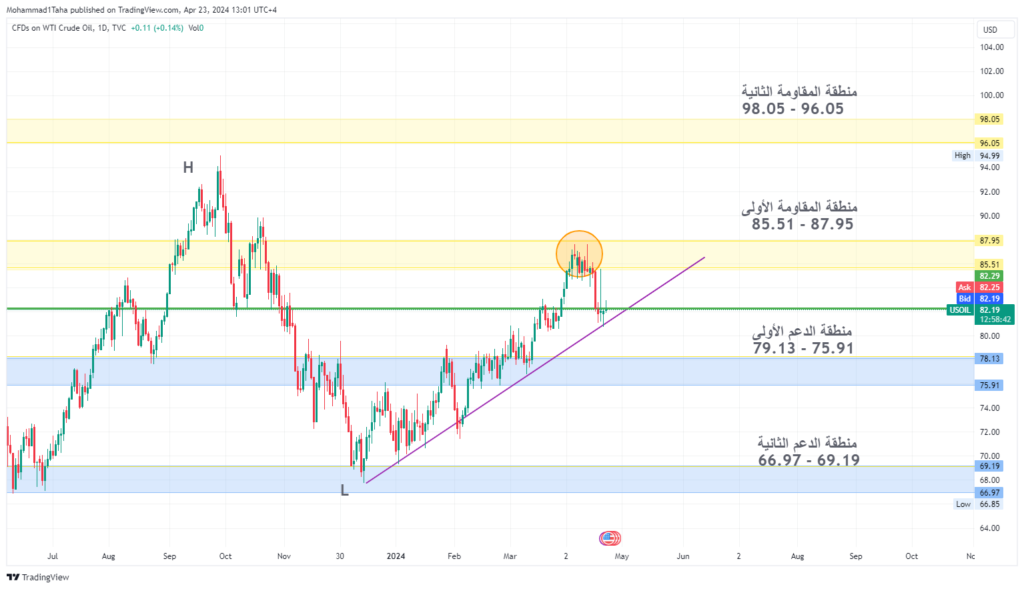
Four-hour chart for oil:
On the four-hour time frame, Oil seeks to break the first resistance area located between the levels of 85.51 up to the levels of 87.95, as the price attempted to break through the first resistance area, but failed to break it the first time. If it fails to break it, the price will fall to the first support levels, and if it succeeds in penetrating the first resistance area, it will It targets the second resistance levels located between 96.05 and 98.05 per barrel
Focal point: 82.22
First support area: 79.13 – 75.91
Second support area 66.97 – 69.19
First resistance area: 85.51 – 87.95
Second resistance area: 98.05 – 96.05
Dow Jones pair
Since October 30, 2023, until today, the Dow Jones has risen to more than seventy thousand points, with a change rate of 23.95%. During the past two weeks, the Dow Jones closed sharply in decline, and last week closed in the negative, represented by a Doji candle on the weekly frame, which may indicate a rebound in the price during the periods. Coming. Since the opening of the markets yesterday until this morning, we have witnessed a noticeable increase and it is currently trading at levels of 38258
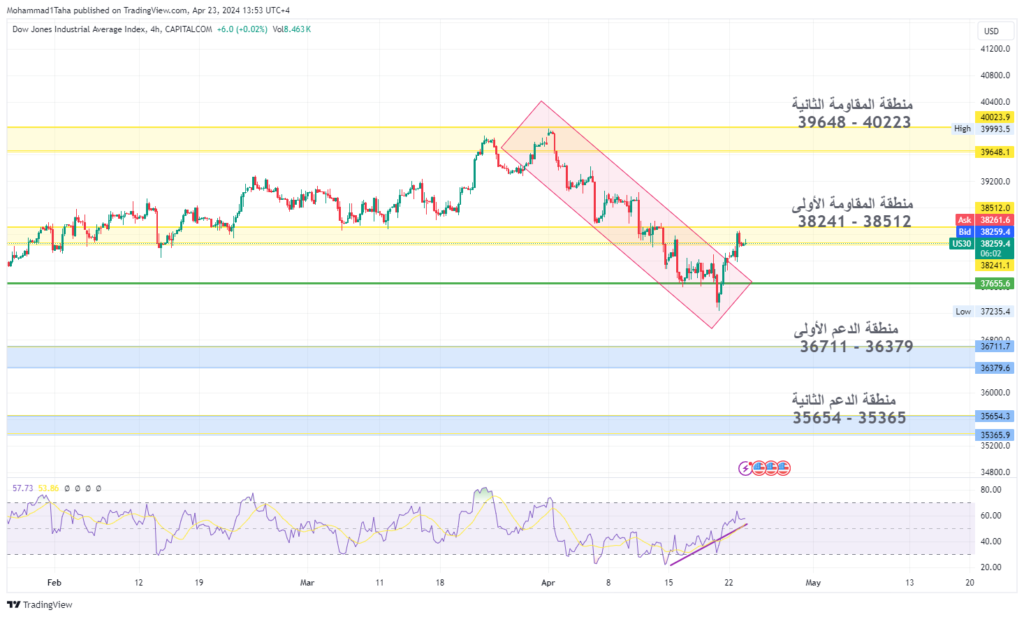
The four-hour chart of the American Dow Jones:
On the four-hour time frame, The Dow seeks to penetrate the first resistance area located between levels 38241 up to levels 38512, and the pair will appear in the form of a rebound. In the event that the first resistance area is broken and close above these levels, the next stop will be targeting the second resistance levels at levels 39648 up to 40223. In the event that the pair is unable to break the levels The first resistance is likely to bounce and retest the first support levels, and we will see the decline continuing for some time.
Pivotal point: 37655
First support area: 36711 – 36379
Second support area: 35654 – 35365
First resistance area: 38241 – 38512
Second resistance area: 39648 – 40223
Gold pair against the US dollar (XAUUSD).
Gold prices have risen against the US dollar since November 4, 2023 to this day, to more than eight hundred dollars per ounce, with a change rate of up to 50%. During the past week, gold closed higher in an attempt to achieve new prices above $2,431. From the opening of the markets yesterday until this morning, Gold continues to fall, as since yesterday the price has fallen to more than $100 per ounce and is currently trading at levels of $2,300 per ounce.
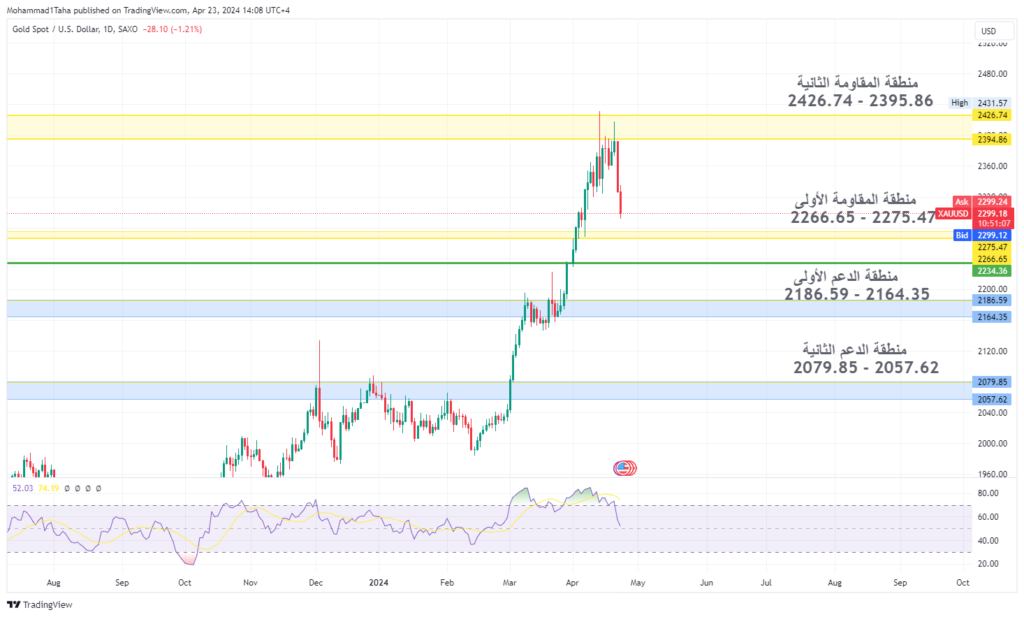
Daily chart for gold pair:
On the daily time frame, All technical indicators indicate further decline in an attempt to return to the first resistance area, which in turn will represent a support area at the levels of 2266 up to 2275 dollars per ounce, and a rebound at these levels is possible. In the event of closing below these levels, the next stop will be targeting the first support levels at Levels 2186 up to 2164. If the pair is unable to break the first support levels, it is possible to rebound and retest the first resistance levels, and we will see a correction for some time.
Focal point: 2234.36
First support area: 2186.59 – 2164.35
Second support area: 2079.85 – 2057.62
First resistance area: 2266.65 – 2275.47
Second resistance area: 2426.74 – 2395.86
Bitcoin/US Dollar pair BTCUSD
Bitcoin, the most famous digital currency, which is considered the mother of digital currencies, has risen since January 2, 2024 to this day, to more than fifty-seven thousand dollars per currency, with a change rate of up to 351%. During the past two weeks, Bitcoin closed with a noticeable decline after reaching the highest price ever recorded. For Bitcoin, it is 73794 thousand
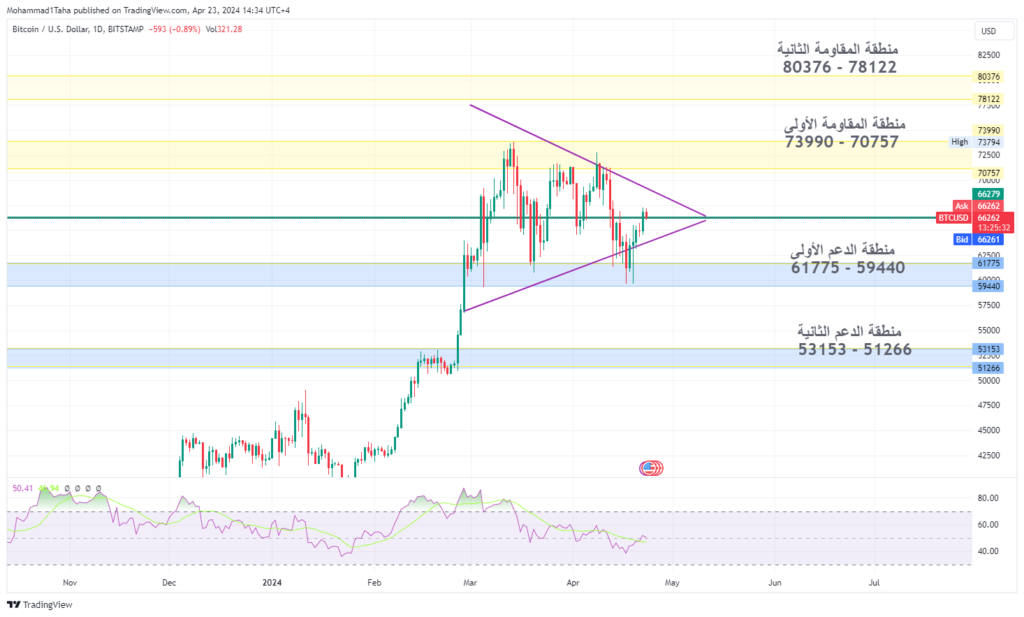
Bitcoin daily chart:
On the daily time frame, Bitcoin seeks to break and stabilize any of the first resistance area and the first support area to determine its path whether to continue the decline or to return to the rise again and attempt to break new prices. The price of Bitcoin is currently trading at 66279, which is considered the pivot area for Bitcoin, and in the event of breaking the first support area located between the levels of 61775 Until the levels of 59440, the pair will appear in the form of a sideways movement. In the event that the first support area is broken and close below these levels, the next stop will be targeting the second support levels at levels 53153 up to 51266. In the event that the pair is unable to break the first support levels, it is possible to rebound and retest the levels. The first resistance and we will see a correction for some time. The sideways movement, as shown in the chart, indicates the presence of profit-taking and purchasing operations that led to price stability after the decline from the second resistance area, which amounted to 4%.
Focal point: 66279
First support area: 61775 – 59440
Second support area: 73990 – 70757
First resistance area: 80376 – 78122
Second resistance area: 1.08834 – 1.08618