In the fast-paced world of financial markets, where fortunes are made and lost in the blink of an eye, having a reliable trading strategy is paramount. One such strategy that has gained immense popularity among traders worldwide is the use of Bollinger Bands.
These versatile and powerful tools can be your key to unlocking consistent profits in the world of trading. In this comprehensive guide, we delve deep into the world of Bollinger Bands, explaining what they are, how they work, and how you can use them to outperform your competition.
Understanding Bollinger Bands
What are Bollinger Bands?
Bollinger Bands, developed by renowned technical analyst John Bollinger, are a popular and effective tool used by traders to analyze price volatility and potential price trends in financial markets. They consist of three lines:
- The Middle Band: This is a simple moving average (SMA) of the asset’s price over a specific period, typically 20 periods.
- The Upper Band: This is calculated by adding a certain number of standard deviations (usually two) to the middle band.
- The Lower Band: Similarly, this is calculated by subtracting a certain number of standard deviations (usually two) from the middle band.
How Do Bollinger Bands Work?
Bollinger Bands are dynamic, adapting to market conditions. They expand and contract as volatility increases or decreases. This dynamic nature allows traders to identify periods of high and low volatility, which can be crucial for making informed trading decisions.
When prices touch or exceed the upper band, it indicates that the asset may be overbought, potentially signaling a reversal or a correction in price. Conversely, when prices touch or fall below the lower band, it suggests that the asset may be oversold, possibly signaling an upward price reversal.
Leveraging Bollinger Bands in Your Trading Strategy
Bollinger Bands as a Trend Indicator
One of the most common applications of Bollinger Bands is to identify trends in the market. Here’s how you can use them as a trend indicator:
- Identify Squeeze Patterns: When the bands contract, it signifies low volatility and a potential breakout. This is known as a squeeze pattern, and it often precedes a significant price movement.
- Spotting Trends: In an uptrend, the price tends to stay near the upper band, while in a downtrend, it hugs the lower band. This can help you confirm the direction of the prevailing trend.
Bollinger Bands for Volatility Analysis
Volatility is a trader’s best friend, as it presents opportunities for profit. Bollinger Bands excel at helping you assess volatility:
- Bands Width: The width between the upper and lower bands indicates the level of volatility. Wider bands suggest higher volatility, while narrower bands signify lower volatility.
- Trading Breakouts: When the bands expand after a squeeze, it often indicates a breakout, providing traders with excellent entry points for their positions.
Bollinger Bands for Entry and Exit Points
The versatility of Bollinger Bands extends to pinpointing entry and exit points in your trades:
- Entry Points: Look for a price that touches or goes below the lower band in an uptrend or touches or goes above the upper band in a downtrend for potential entry opportunities.
- Exit Points: Exit your position when the price touches the opposite band or when the bands start to contract after a significant price move.
Real-world Application of Bollinger Bands
Trading Example
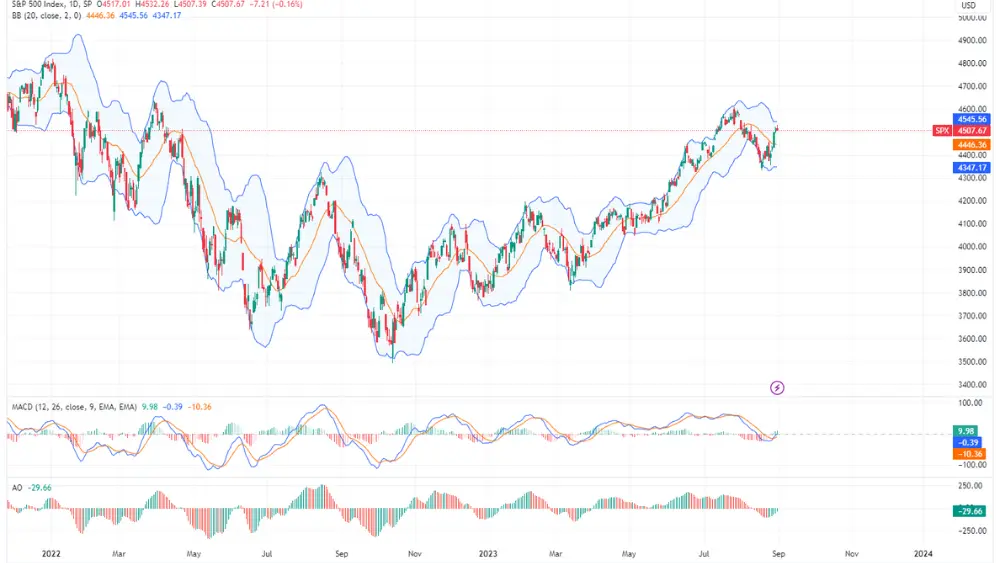
Let’s illustrate the power of Bollinger Bands with a real-world trading example:
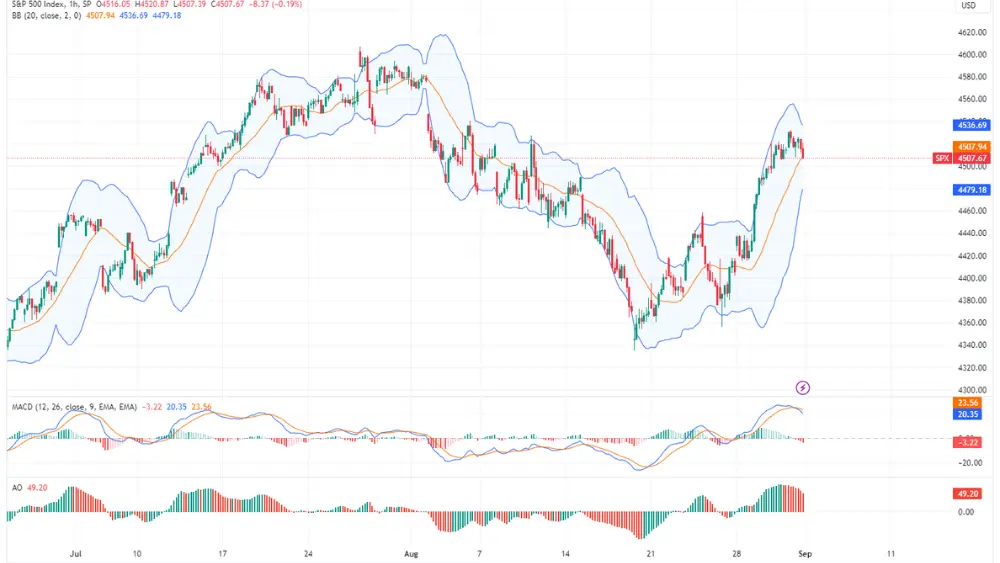
Imagine you’re trading stocks, and you notice a squeeze pattern forming on the daily chart of SPX. This suggests that a significant price movement is imminent.
You decide to enter a long position when the price breaks above the upper Bollinger Band. As the price starts to trend upwards and touches the upper band multiple times, you stay in the trade, riding the trend.
When the price touches the lower band after a prolonged uptrend, you take it as a signal to exit your position, locking in a substantial profit.
Conclusion
In the dynamic world of trading, mastering Bollinger Bands can be your secret weapon for success. These versatile indicators can help you identify trends, assess volatility, and make informed entry and exit decisions. However, remember that no trading strategy is foolproof, and risk management should always be a top priority.
So, whether you’re a seasoned trader looking to refine your skills or a newcomer eager to learn the ropes, incorporating Bollinger Bands into your trading arsenal can be a game-changer. Start honing your skills today and watch as your trading prowess soars to new heights.