
INTRODUCTION:
Every trending asset has three phases: the beginning of the trend; the middle of the trend; and the end of the trend, from where we will be looking for a change in market direction. Knowing where and when to come in the market is very key to your success in financial trading.
FUNDAMENTAL ANALYSIS:
US Dollar recorded increase as more labor market data is watched closely. the USD continues to rise on the back of conflicting data from the ADP and ISM service PMIs. Above expectation, the US ISM Service PMI increased from 49.4 in April to 53.8 in May. The US economy will be further illuminated by Nonfarm Payrolls and Wage Inflation Figures, which are expected to be released soon. On Thursday, the ECB is expected to lower interest rates for the first time in five years. Following the BoC rate drop, the Canadian dollar flattens. The rate cut cause the Canadian dollar to lose some value against the US dollar. Gold shines brightly amidst mixed US economic statistics and lower Treasury yield. the price of gold is rising by 1.18%. The growing rumors of the September rate decrease by the Federal Reserve have caused WTI to surge toward $74.50. the WTI price rises as US mixed data fuels rate cuts and discourages Fed speculation.
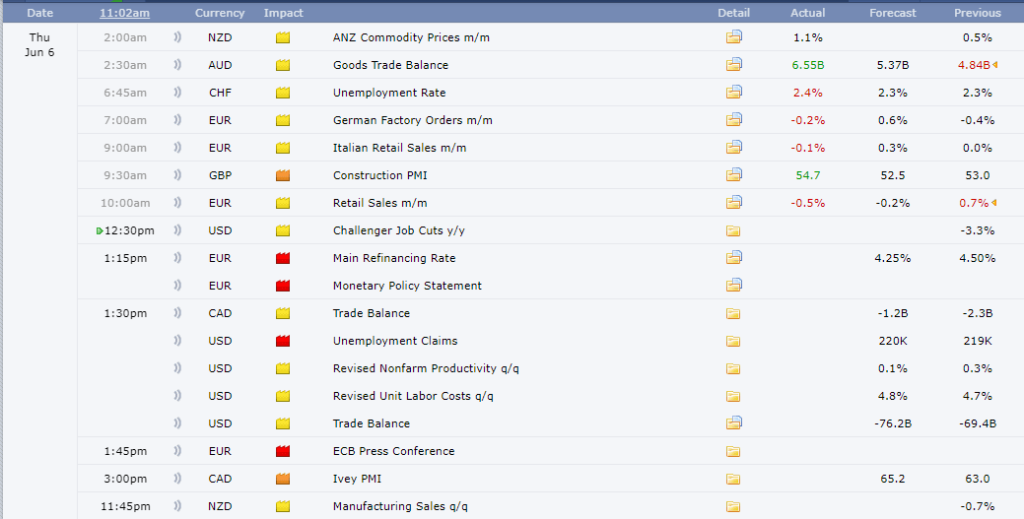
ECONOMIC CALENDAR (GMT+1)
EURUSD ANALYSIS:
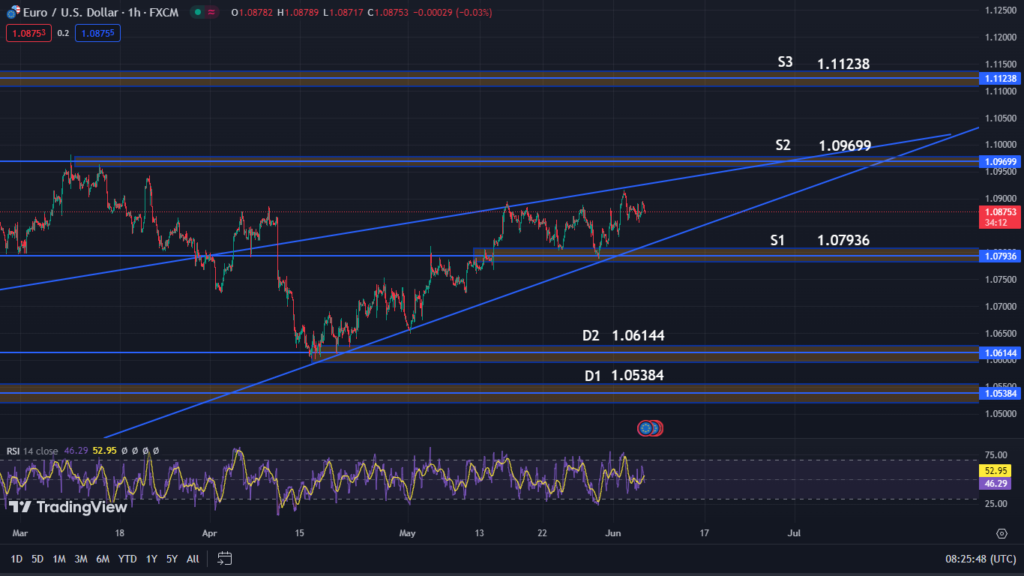
Looking at the chart above, we expect EURUSD to drop to retest our trendline support and push upward to our supply zone S2@ 1.09699. Alternatively, if it breaks the trendline support and demand zone [email protected] may push down to demand zone [email protected].
GBPUSD ANALYSIS:
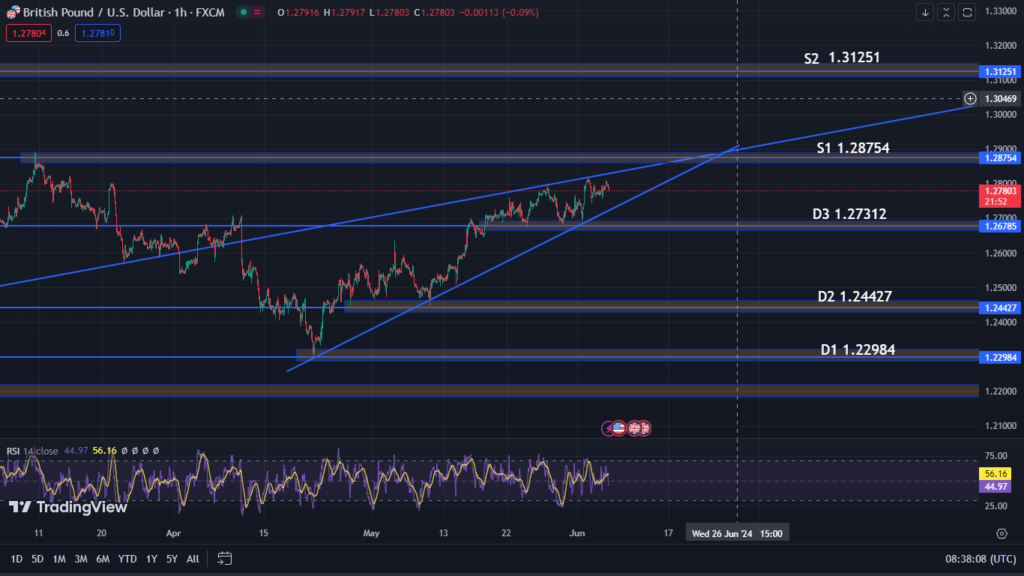
From the chart above, we expect GBPUSD to push further to test our supply zone [email protected], if the trendline resistance holds we expect GBPUSD to break the trendline support and then to the demand zone D3@ 1.27312 and [email protected]. Again, if the trendline support hold, then we expect the market to break our trendline resistance and supply zone [email protected] and then to S2@ 1.31251.
GBPJPY ANALYSIS:
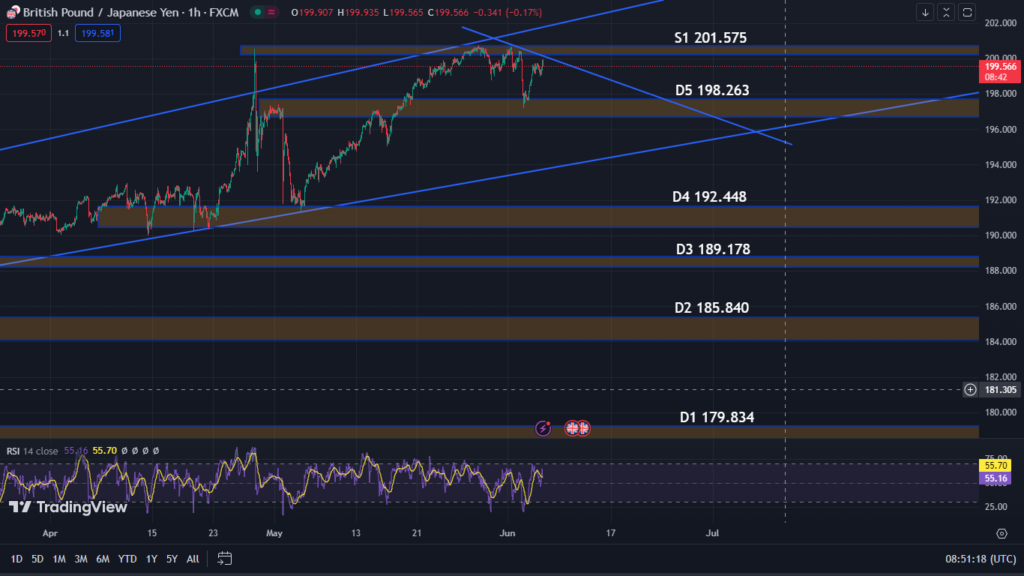
From the chart above, we expect GBPJPY to push down from our supply zone [email protected] to retest demand zone [email protected] and breaking further to test our trendline support and demand zone D4@ 192.448.
XAUUSD ANALYSIS:
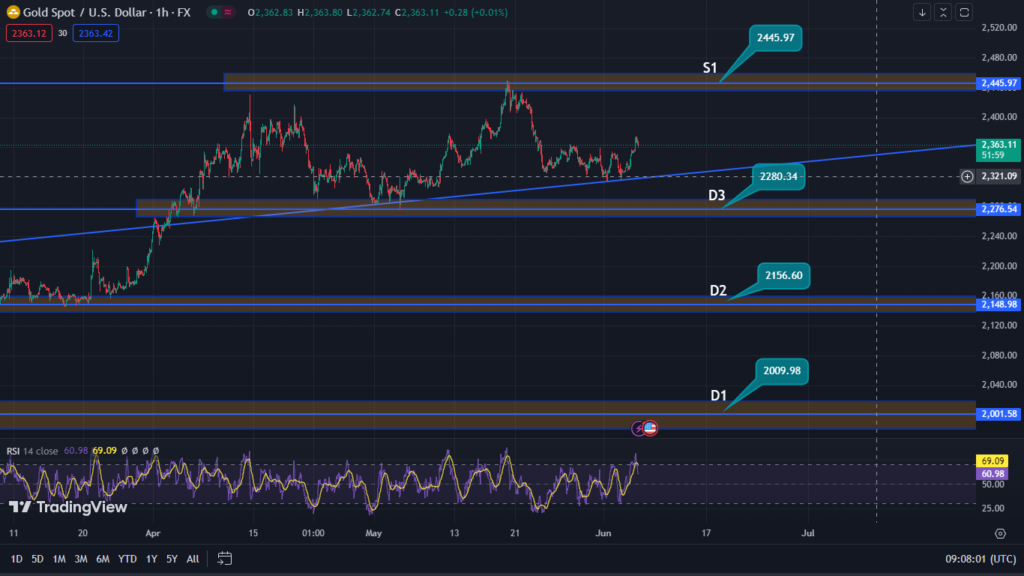
From the chart above, we expect gold to dip down a little and push up to our supply zone [email protected]. But if it breaks the trendline support and demand zone [email protected], we expect it to touch the demand zone D2@ 2156.60.
WTI ANALYSIS:
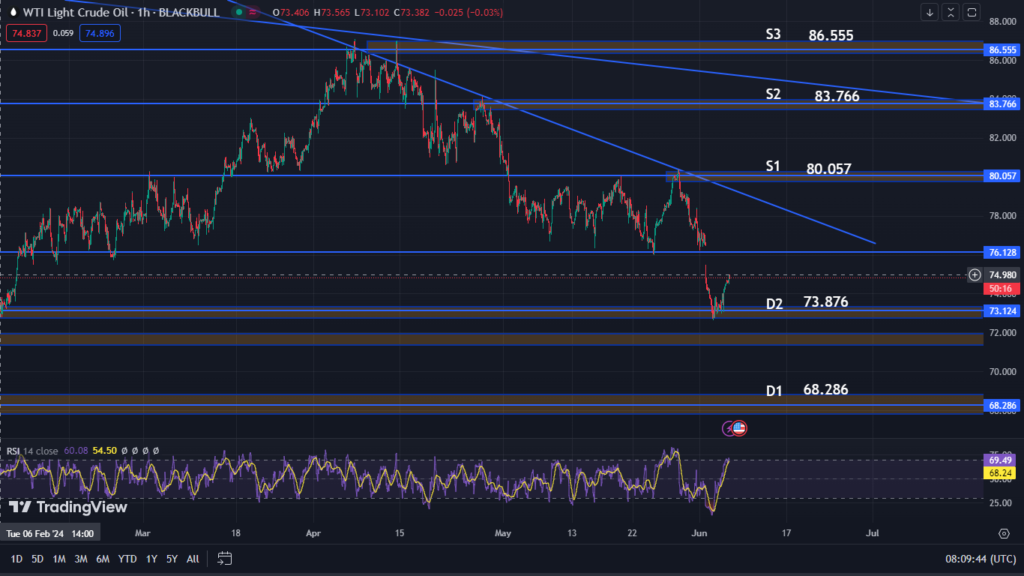
Looking at WTI, we expect it to fill the gap @76.128 and may push down from that price back to our demand zone D2 @ 73.876. Again, it may fill the gap and also retest our trendline resistance before pushing downward as our RSI is also overbought.
CONCLUSION:
Of all the indicators available to help you analyze your chart, your eyes are the best indicators to help you see the market clearly. Db-investing is one broker that will help you train those eyes of yours, to see your dreams.
Join us at: https://my.dbinvesting.com/links/go/955